Platform updates
An overview of all updates and upcoming features. Subscribe to our newsletter to stay up-to-date.

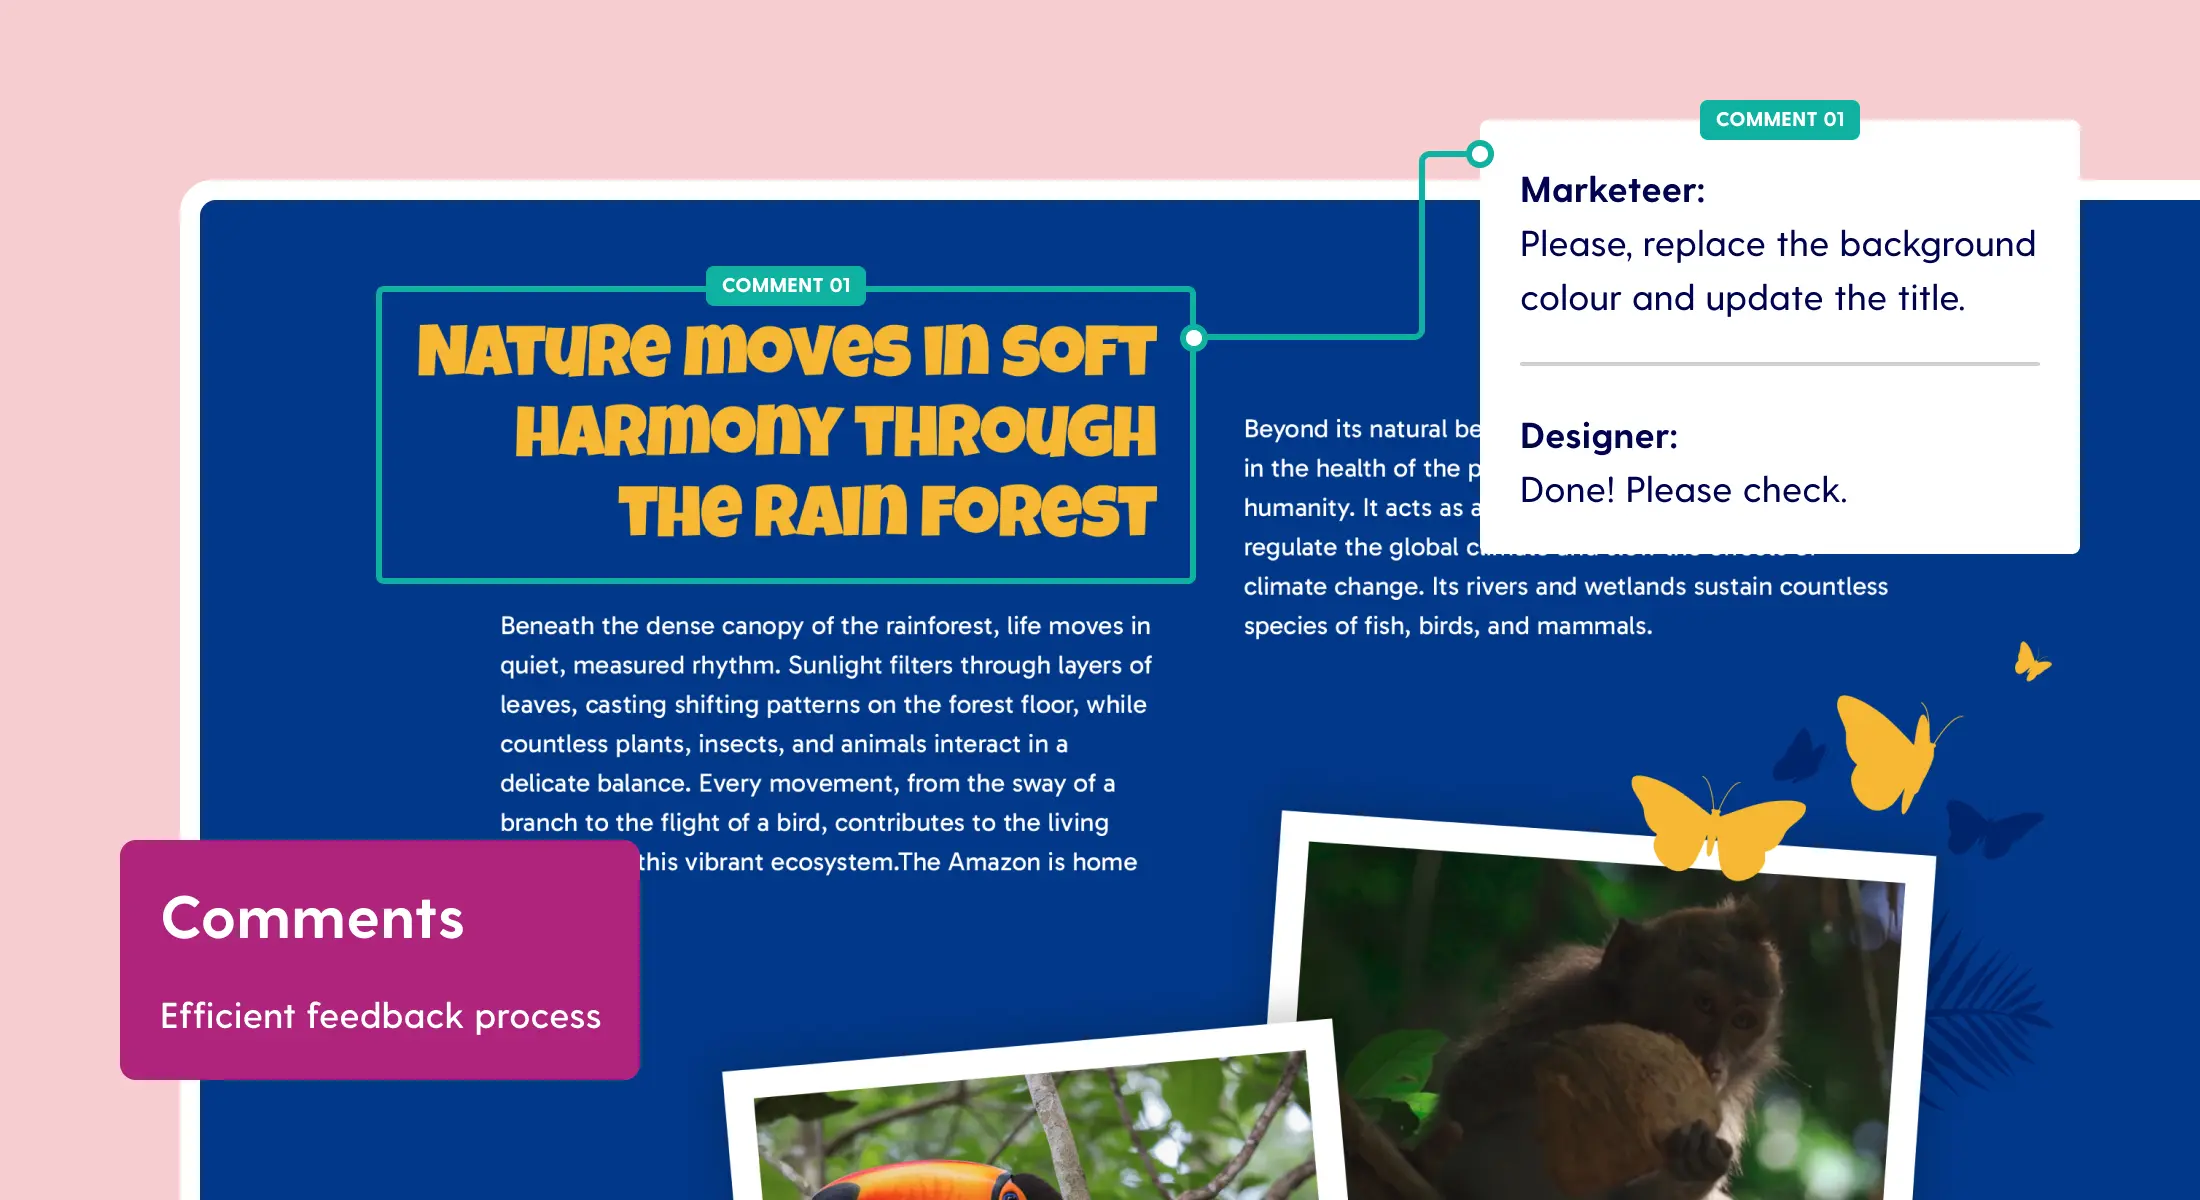
Add comments on previews and resolve them within the Pro editor
Streamline your feedback process by enabling comments on previews.
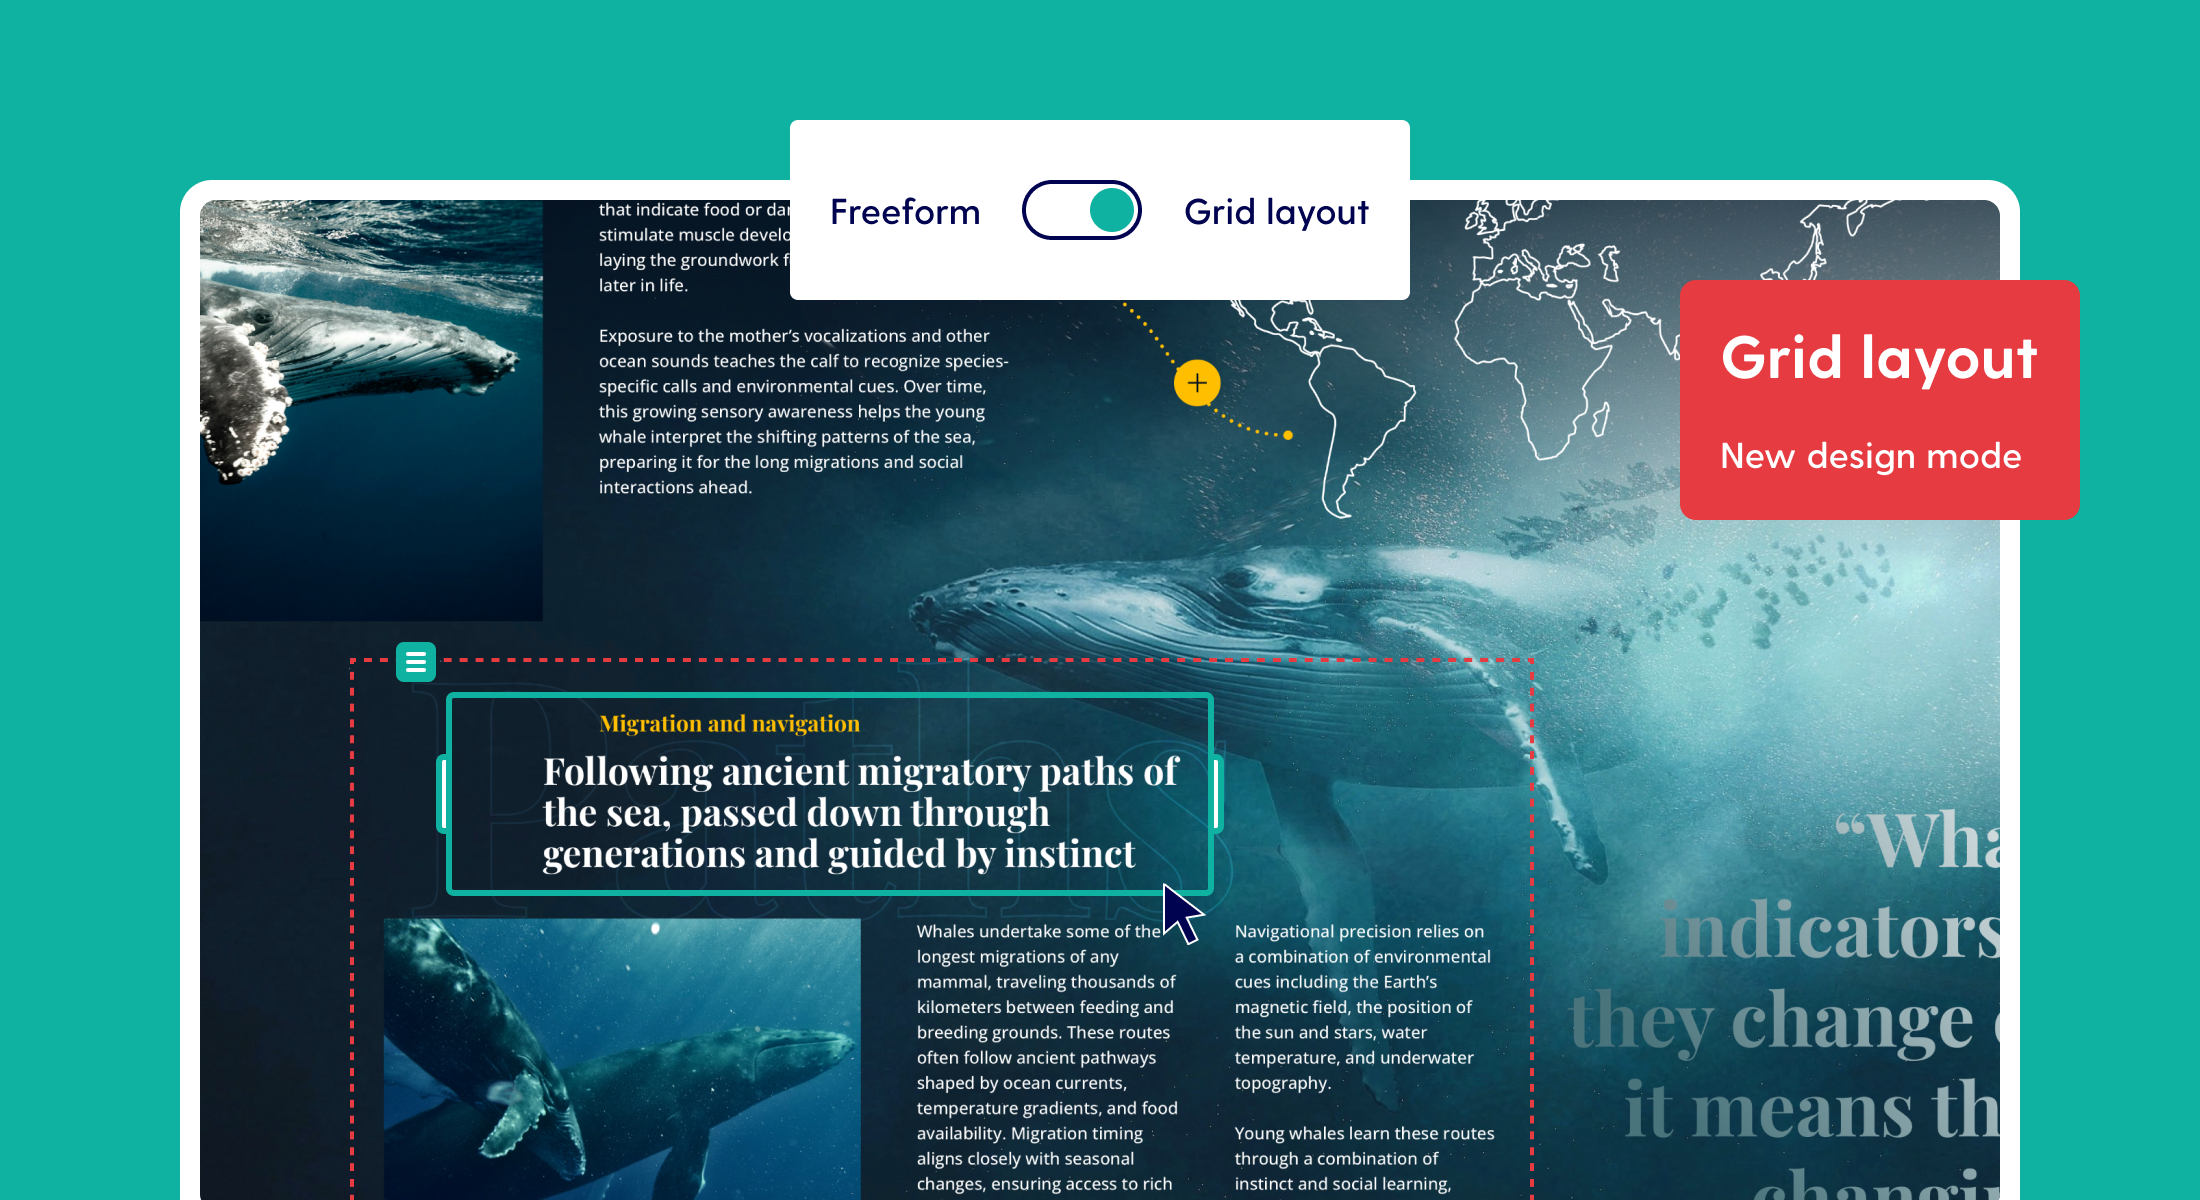
Upcoming releases and what else is “cooking” (grid layout, Figma plugin, comments & more)
A big update with big news: find out what's to be released in the upcoming months!
More updates

Update: creating previews of live projects
With our platform, it is possible to create and share a preview of your project before you publish it live. However, before this update, new adjustments that were made afterwards had to be published live immediately without a preview.

Update: Maglr Pro’s new features and improvements
Creating interactive content never has been this easy before. Our Maglr Pro editor has got a big update. And we're damn proud of it too. Do you want to know what has changed? Then read on!

Maglr Update 2020 (3 of 3)
October 2020 - In this last article of our 3-series update, we guide you through every new change of the dashboard. We have made it easier to manage, share and preview your projects.

Maglr Update 2020 (2 of 3)
In this second part of our 3-series update, more ways to share and secure your domain and publications. We’ve added new security options and gave marketers the opportunity to gain better insights from the publication and user data. s

Maglr Update 2020 (1 of 3)
August 2020 - We have worked hard from home and in the office to make improvements to our platform. And a lot has changed since our last update, that’s why we will be sharing and explain all changes in a series of three articles.

Update: Mobile Animations in Maglr Pro
Bring your publications to life on mobile devices! In this article we will tell you more about the latest updates in our Maglr Pro editor.

Update: renewed Maglr dashboard
Since today you will be redirected to our updated dashboard after logging in. Not only the visual appearance has changed, but we also added some new and better features. In this blog we will guide you through all the new changes.

New element positioning in Maglr Pro
With the addition of more and more options, the positioning of elements within the editor became a bit unclear. So it was time for an update. In this blog we will give you an overview with all of the new Pro functionalities.

Update: Stock Images & Integration Image Library
In an online publication it is important to use the best of quality images. In our latest update, we have two new options for adding the perfect image: stock photography and integration with an image library.

Update: Graphs & Charts
Graphs and charts are used to comprehensively visualize data. It is a useful way to quickly explain what you mean in one image. In an online publication you can visually support texts using graphs or charts to convey your message.