May 16, 2019
Update: Graphs & Charts
Graphs and charts are used to comprehensively visualize data. It is a useful way to quickly explain what you mean in one image. In an online publication you can visually support texts using graphs or charts to convey your message.
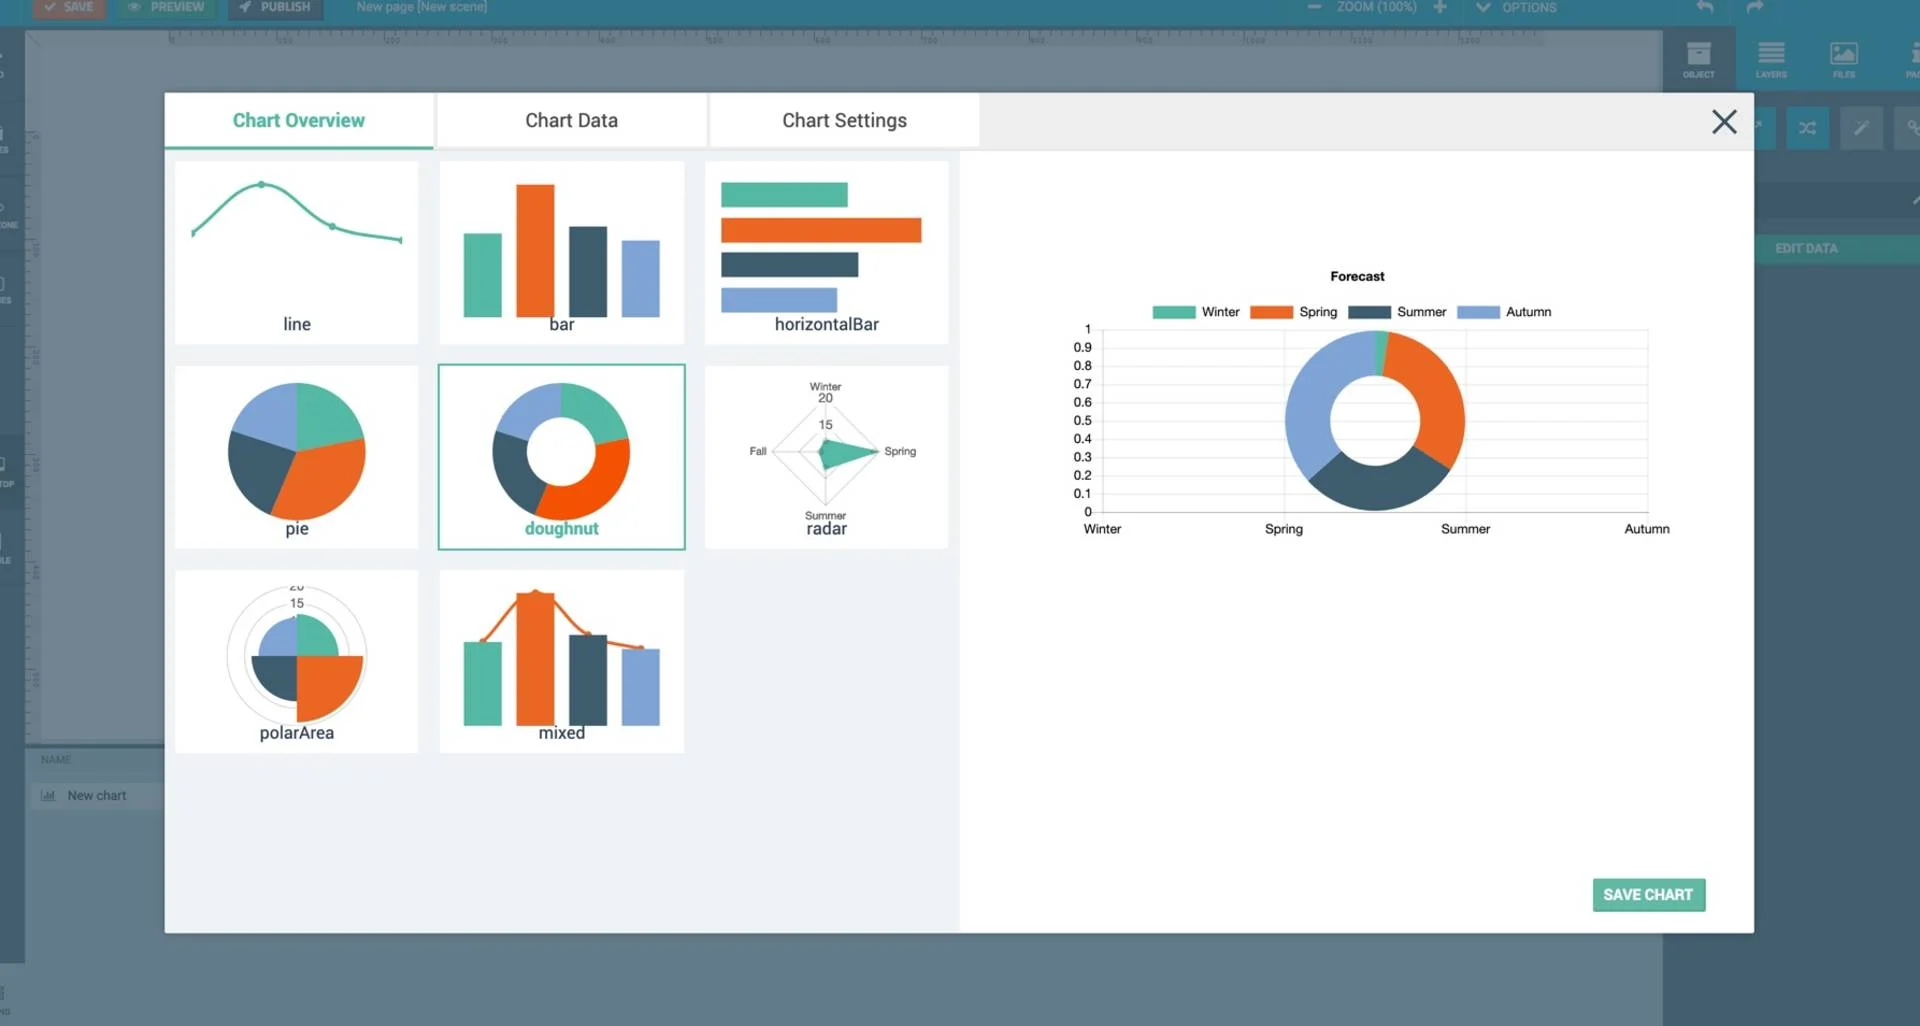
Therefore we have added a new graphing module in both our Template and Pro-editor. And we also made it easy to add one to your publication. After you have added a graph in the worksheet, you can:
1. Choose from different types of graphs and charts

2. Copy data directly from Excel or Powerpoint

3. Fully adjust the graphs in text, color and display style.

Also: each graph is automatically animated whenever it first appears in the publication. Let's make your data make an impact on what you have to tell.
Do you want to stay informed of our updates and news? Then sign up for our newsletter!