Studio case -
United to transform the future of food
JBT Marel

United to transform the future of food
JBT Marel
Studio case -
The Green Times
ICL Group

The Green Times
ICL Group
Studio case -
Groots Kerstspecial 2021
Makro

Groots Kerstspecial 2021
Makro
Studio case -
ESG Report 2021
Stahl

ESG Report 2021
Stahl
Studio case -
Sustainability Strategy up to 2030
BMW

Sustainability Strategy up to 2030
BMW
Studio case -
Summer holidays: join the adventure!
ANWB

Summer holidays: join the adventure!
ANWB
Studio case -
Outremer 55
Outremer

Outremer 55
Outremer
Studio case -
The Bold 24
Bold and Pepper

The Bold 24
Bold and Pepper
Studio case -
Jaarverslag 2019
ONVZ

Jaarverslag 2019
ONVZ
Studio case -
Van Leeuwen Connect
Van Leeuwen Buizen

Van Leeuwen Connect
Van Leeuwen Buizen
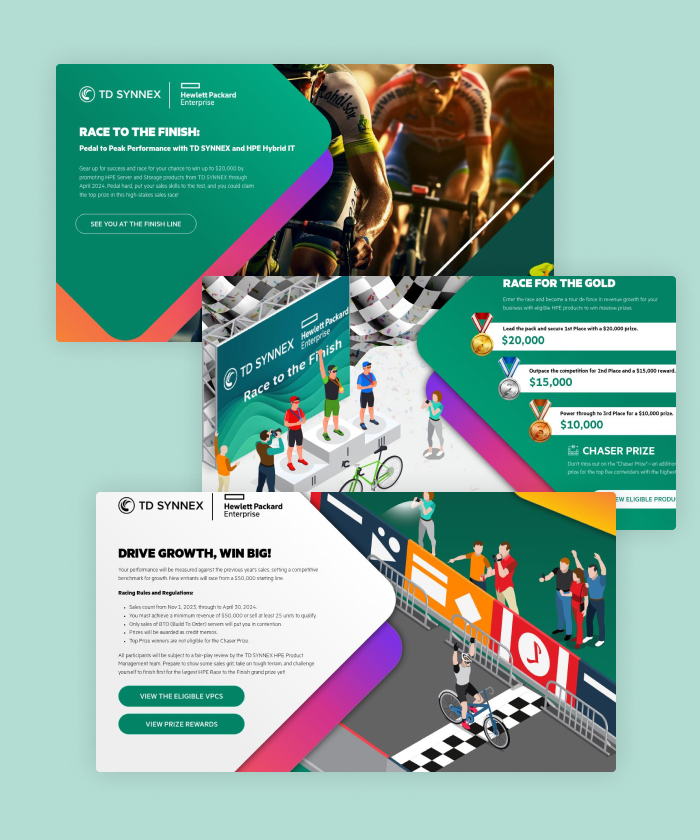
Studio case -
Race to the Finish
TD Synnex
Race to the Finish
TD Synnex
Studio case -
Focus Magazine
Jan De Nul

Focus Magazine
Jan De Nul

