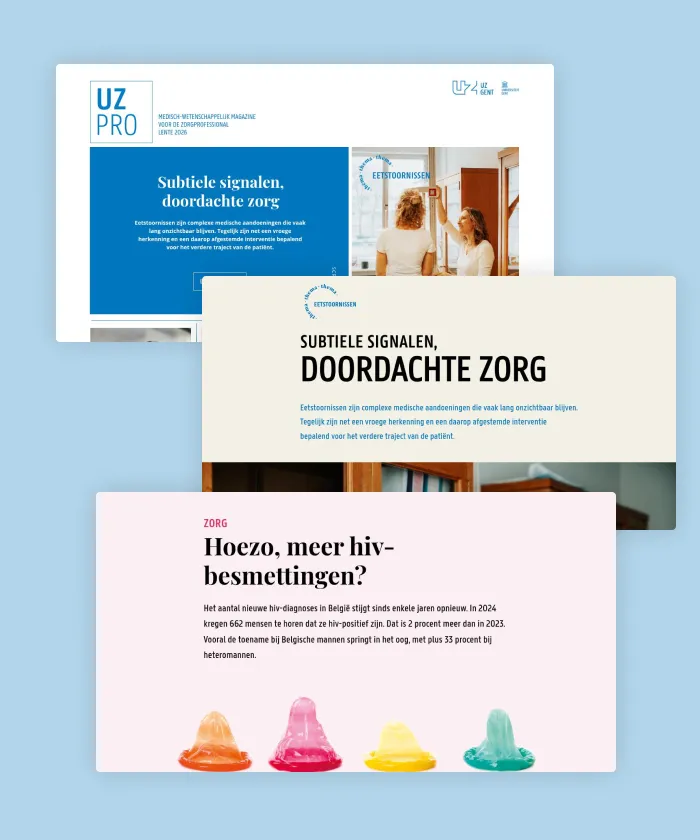
In this quarterly magazine, referring physicians of Ghent University Hospital stay up to date on medical-scientific innovations. Made by JaJa.
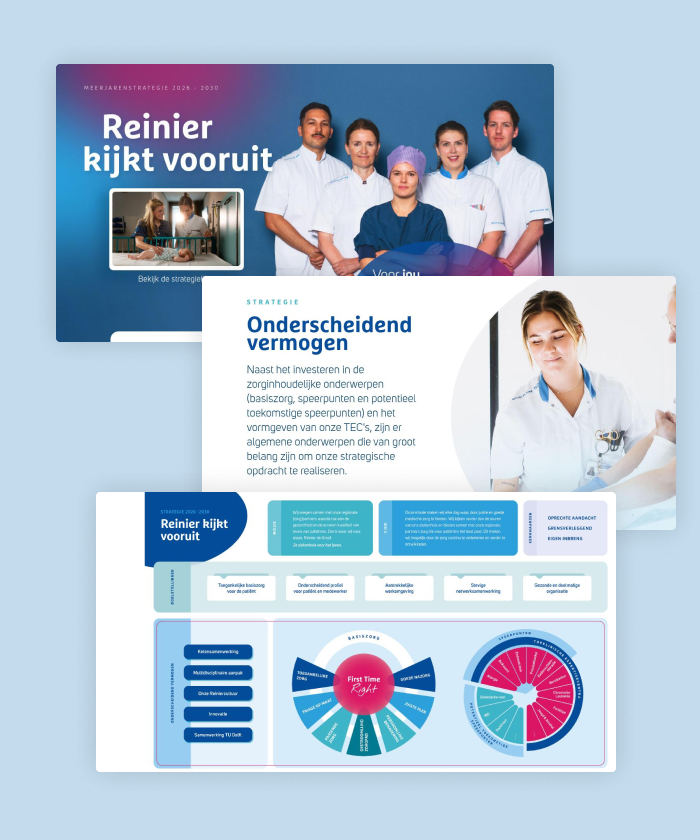
This publication showcases the hospital's future-focused vision, innovative healthcare projects, and strategic developments in patient care.
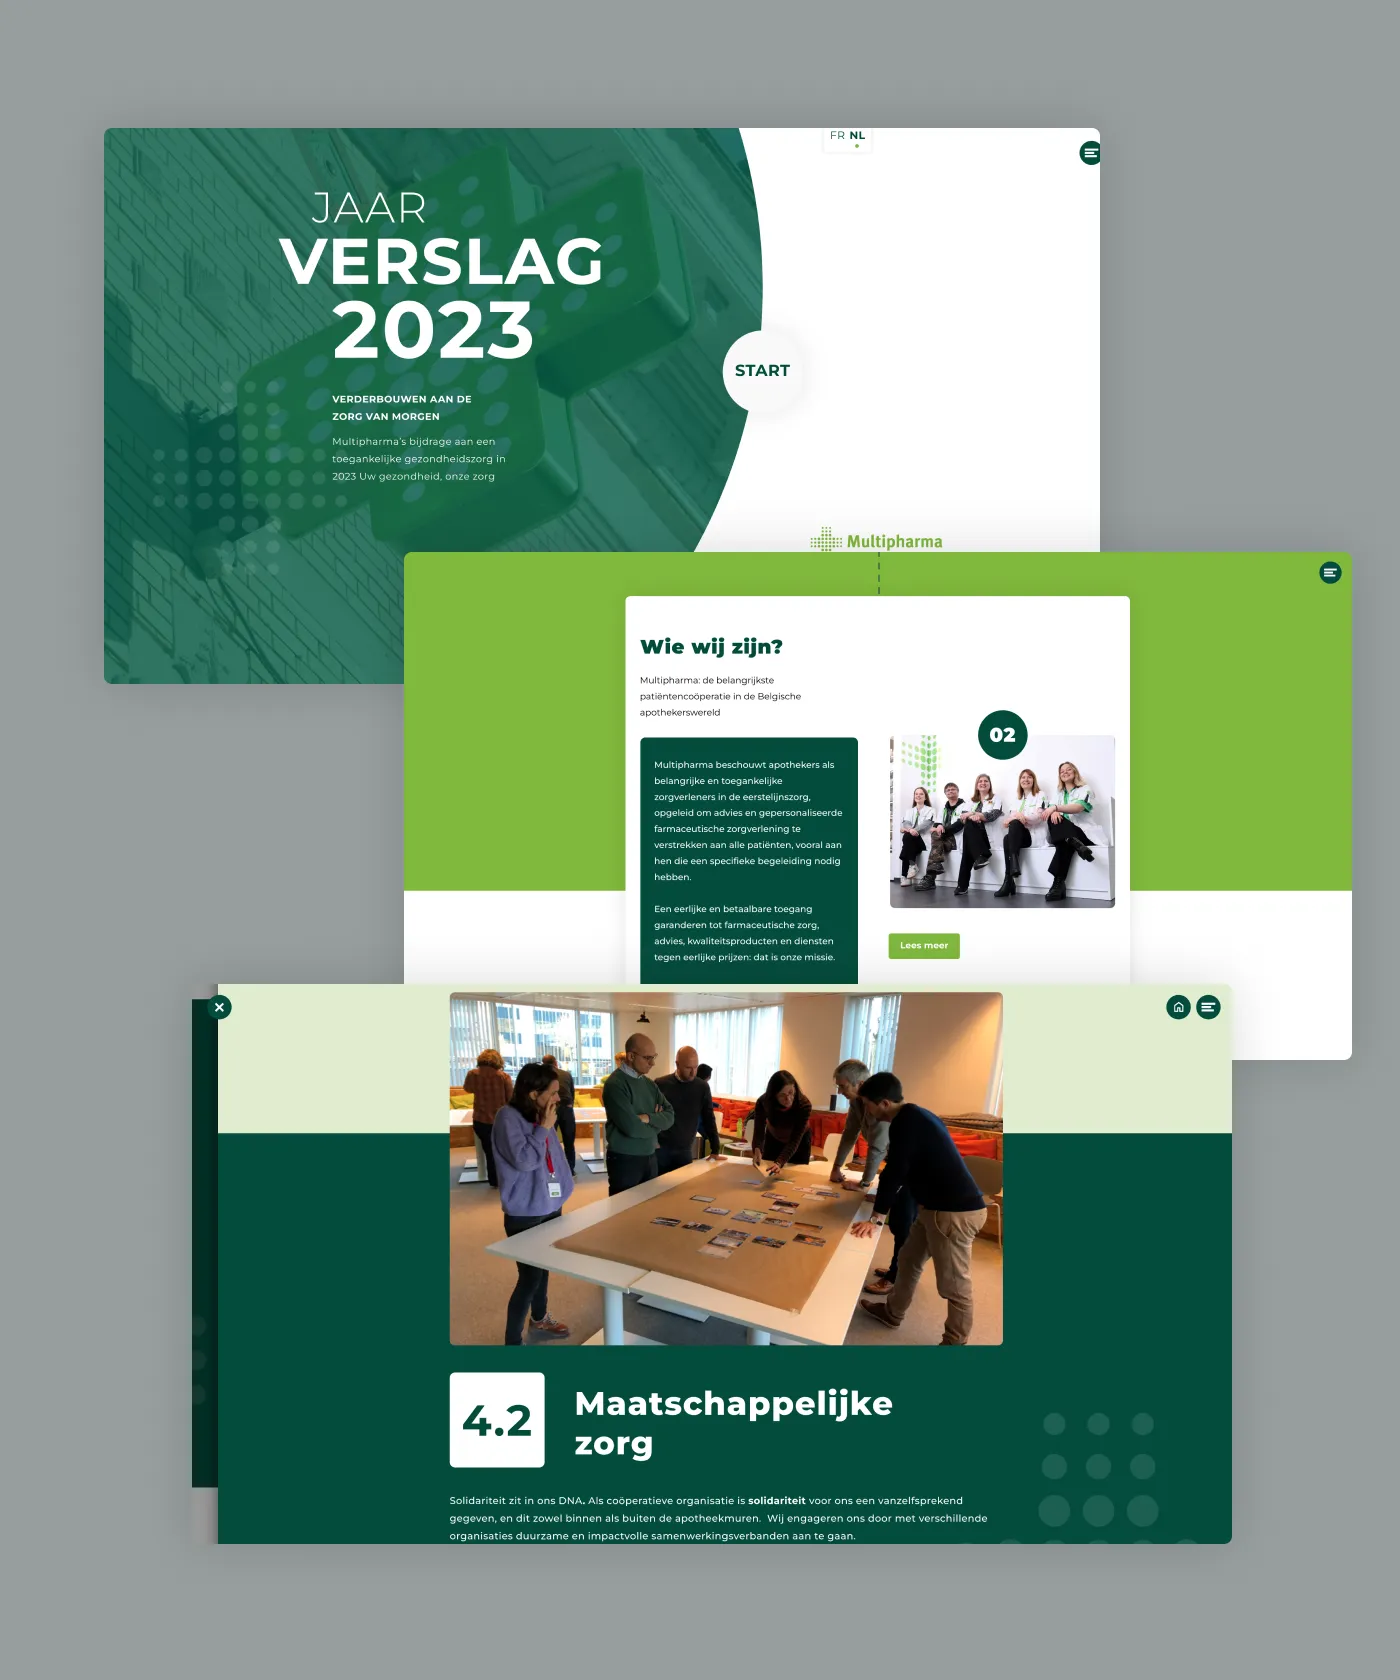
Multipharma's first digital annual report made by our in-house team of designers, Maglr Studio.
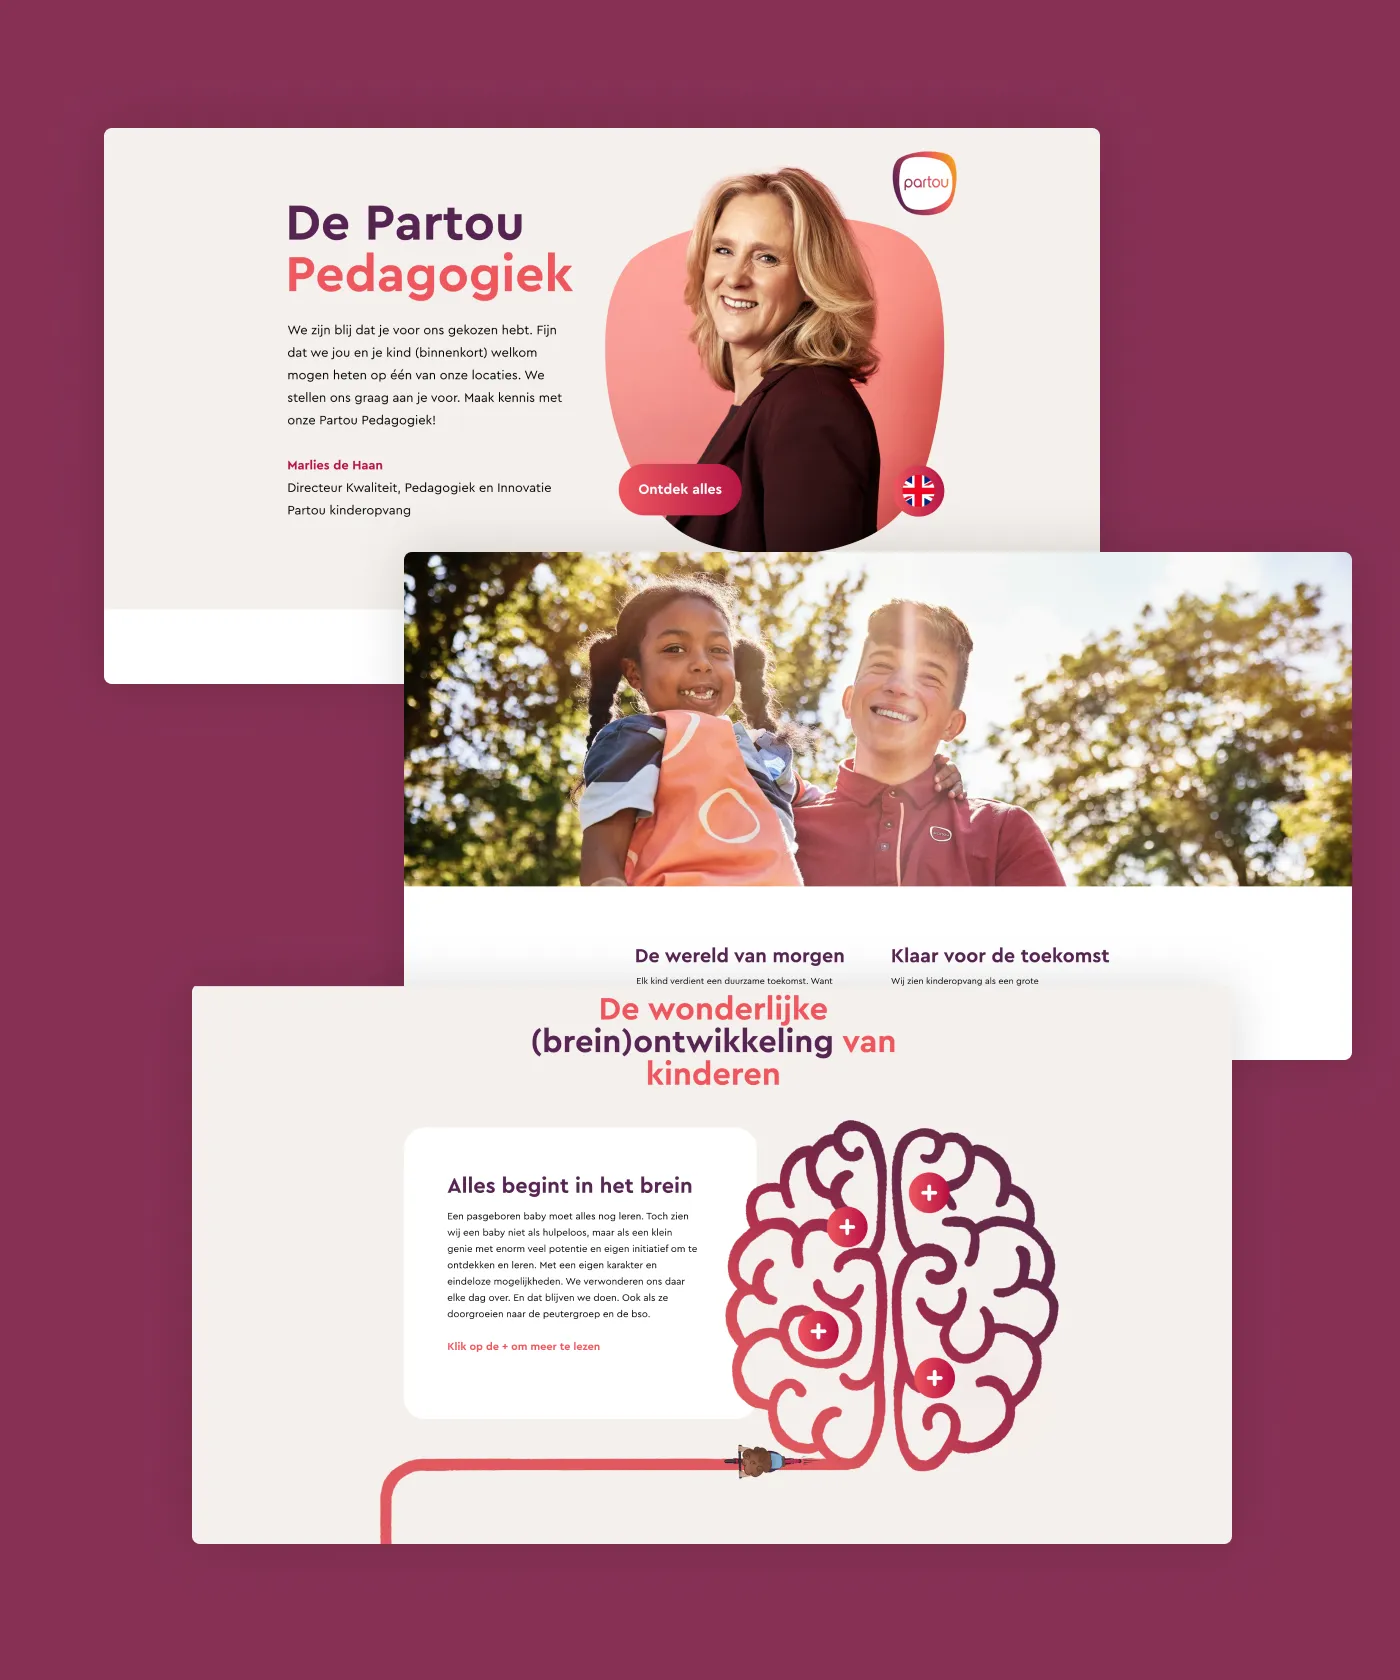
In this interactive digital brochure, Partou takes you through their expertise on children's development.

In this interactive report, Zorg & Welzijn ZHZ shows its numbers and data through the power of interactive content, drastically increasing its readibility.
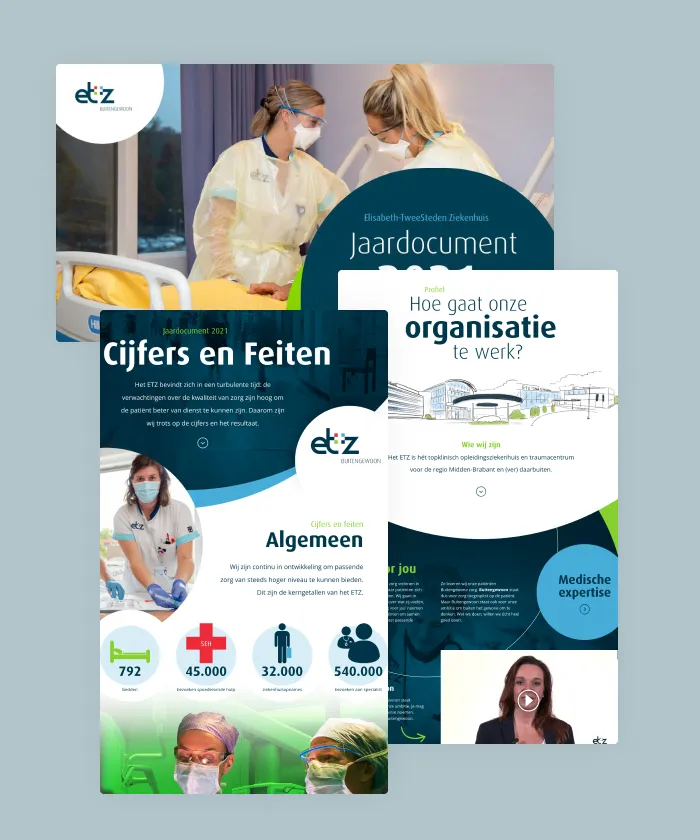
In their interactive year report, ETZ combines mouse movement effects, custom animations and interactions to share their results in 2021.
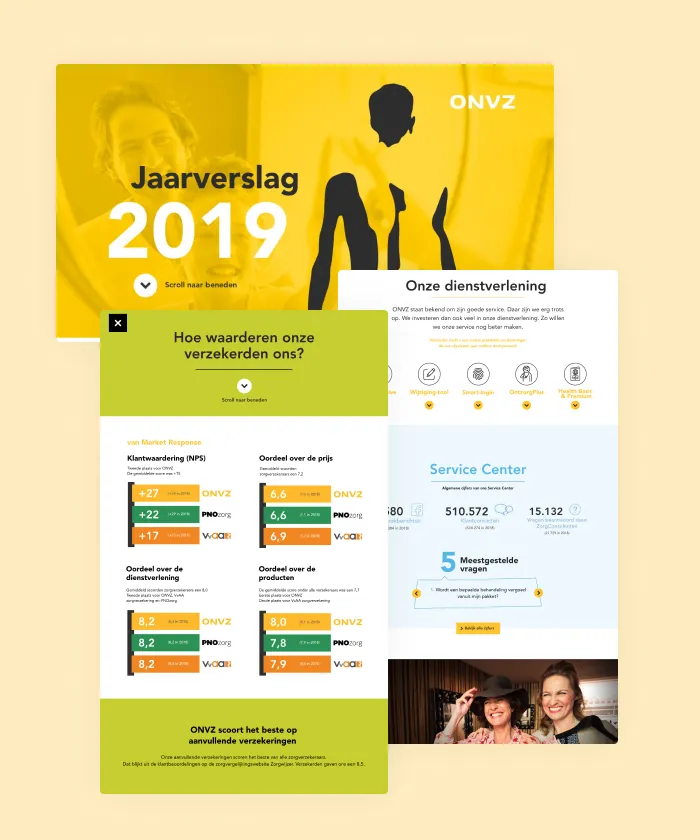
This annual report takes you through the most important numbers in an interactive way. Animations, pop-ups and multilayered pages turn this report into an engaging experience.


