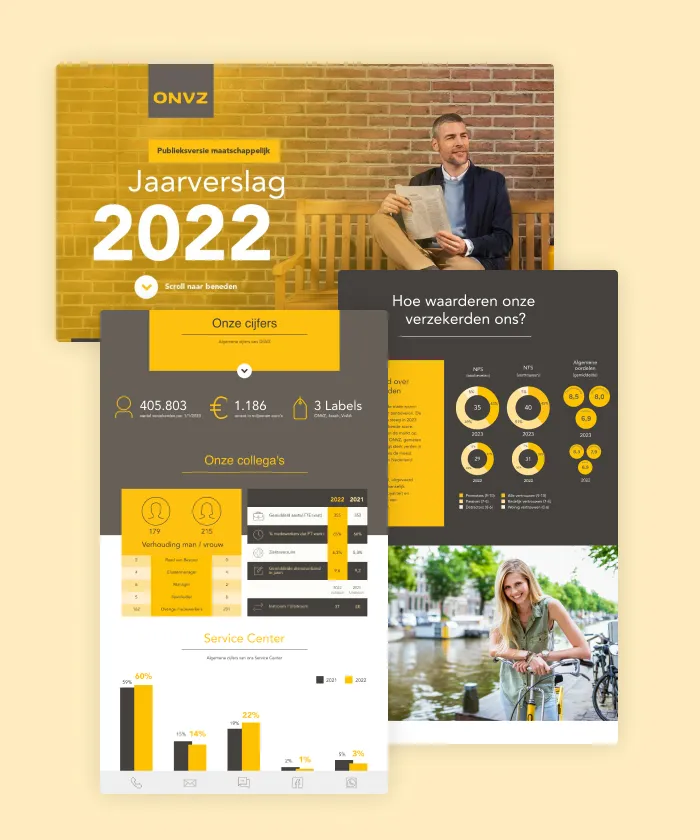
With the digital public version of the annual report, ONVZ provides insight into the results, efforts and services and the experiences of its policyholders and partners in 2022.
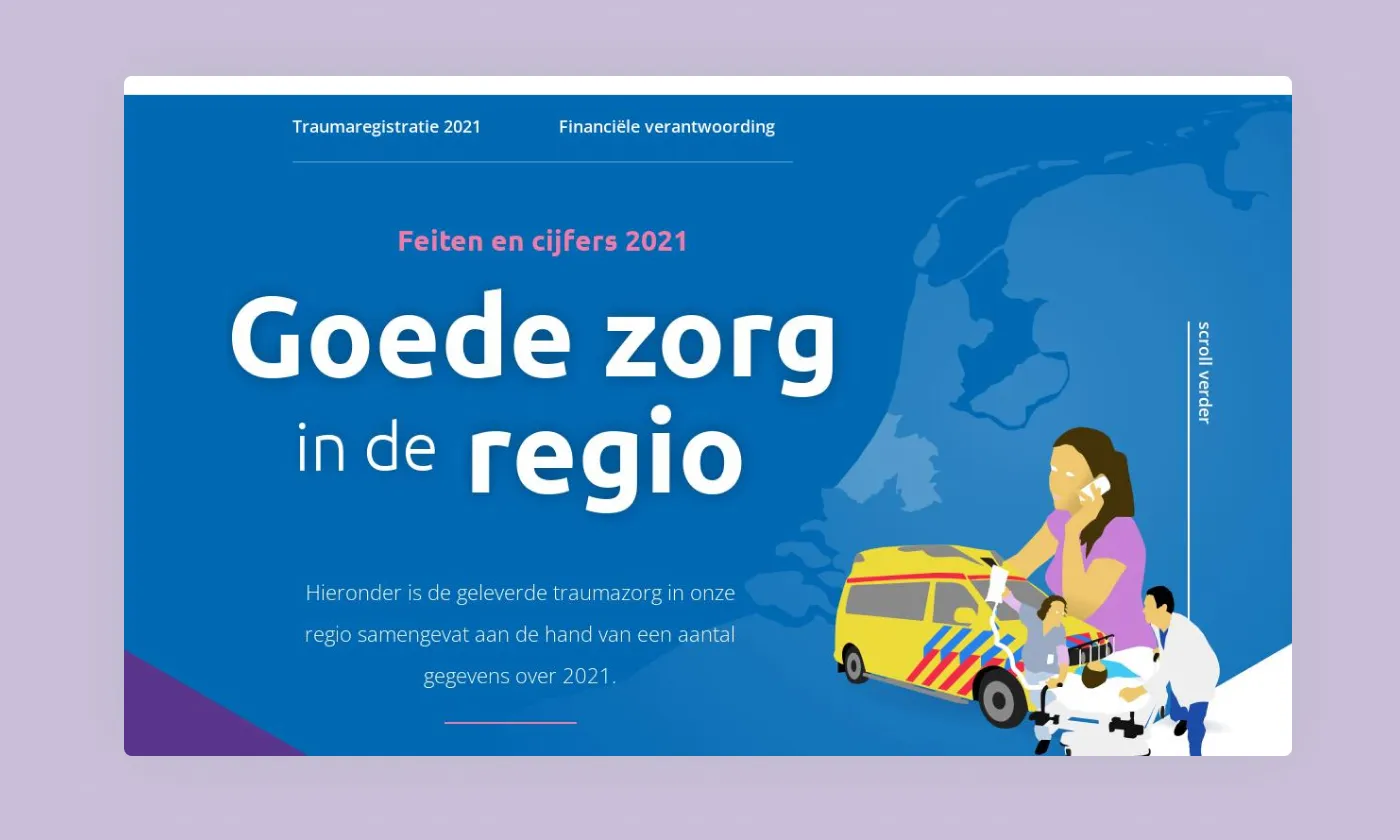
This digital infographic shows all the numbers of NAZW through many interactive elements, animations, and pop-ups.
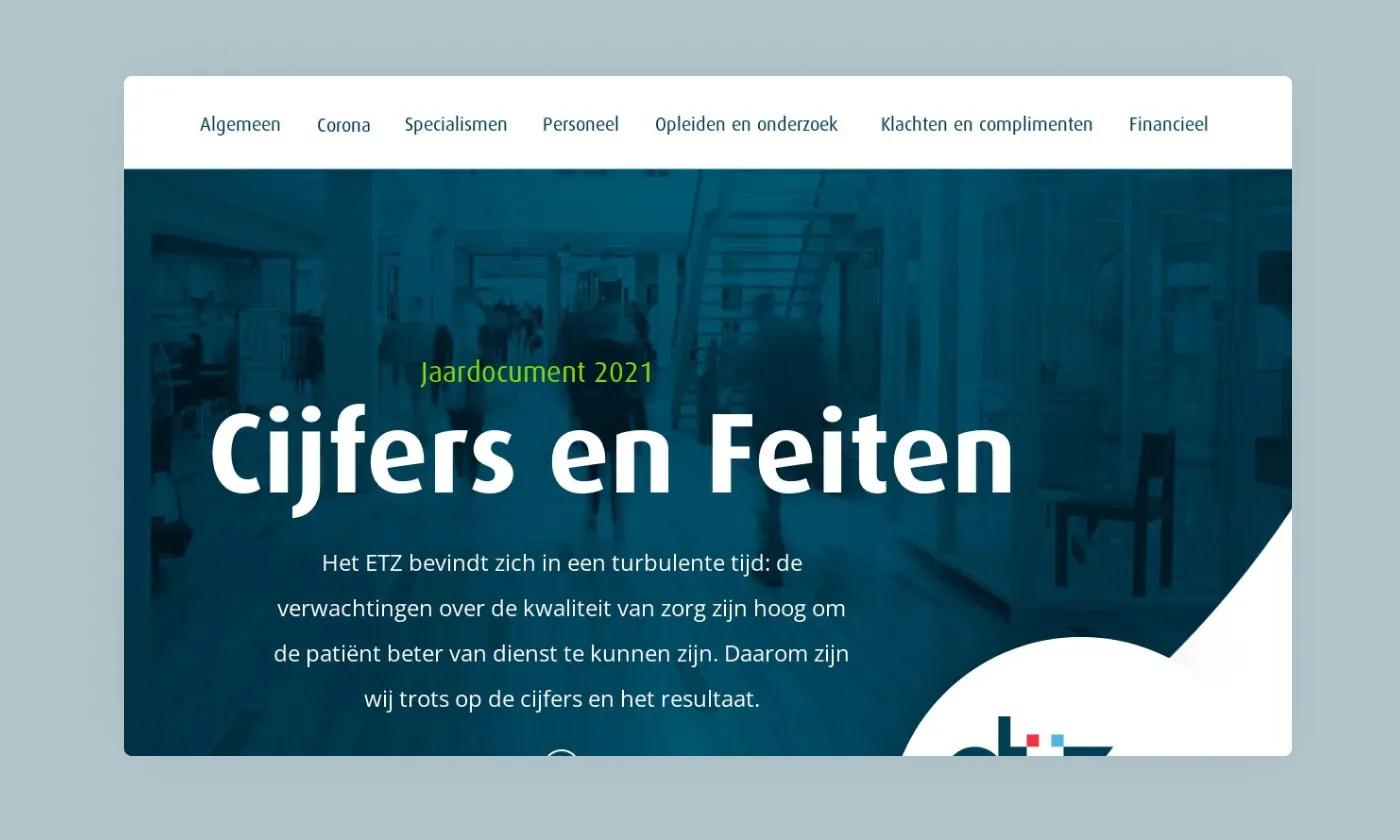
This interactive infographic offers a deep dive into the numbers of ETZ, which are brought to life using custom animations, effects, and pop-ups.
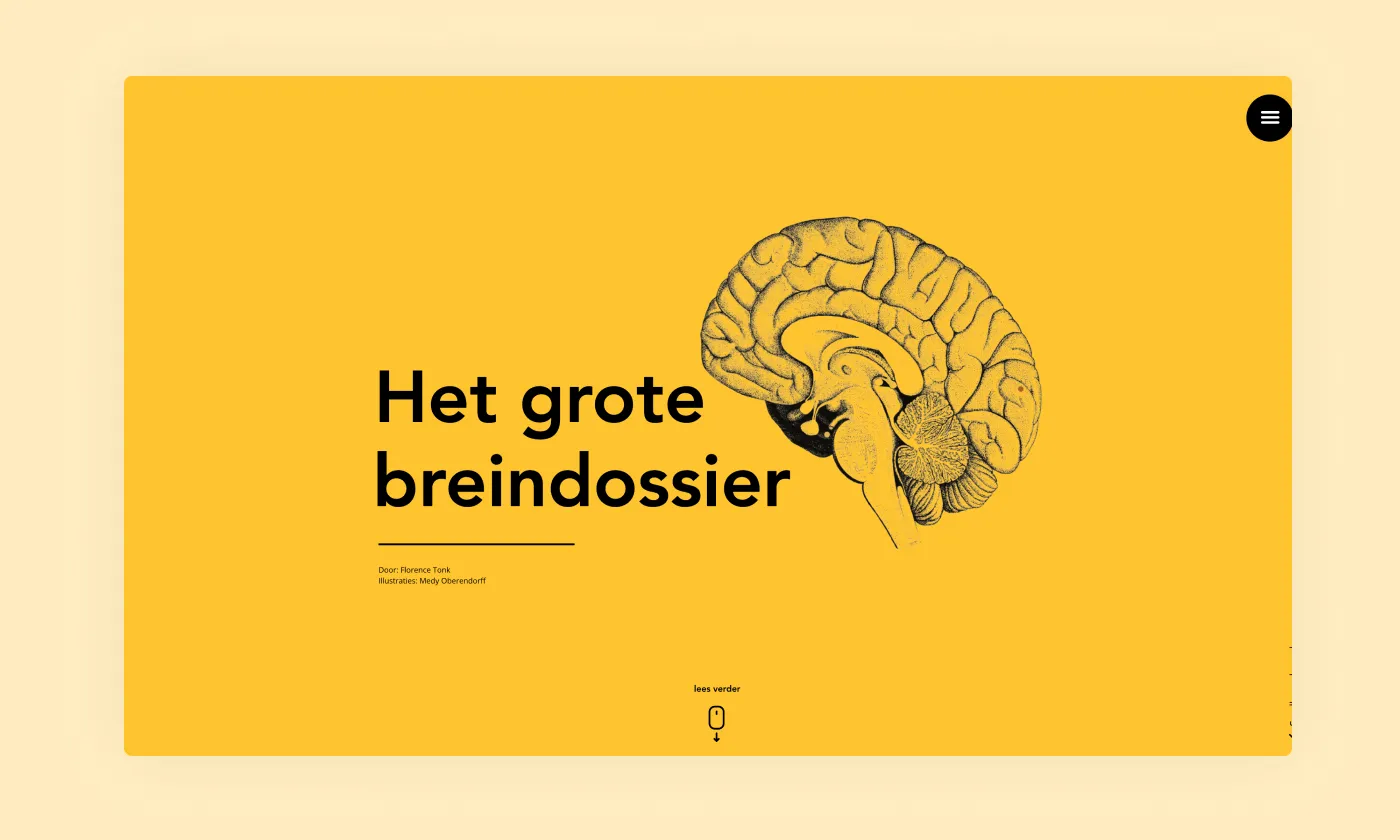
This feature highlight combines hover actions, scrolling animations and sticky elements to explain the brain.
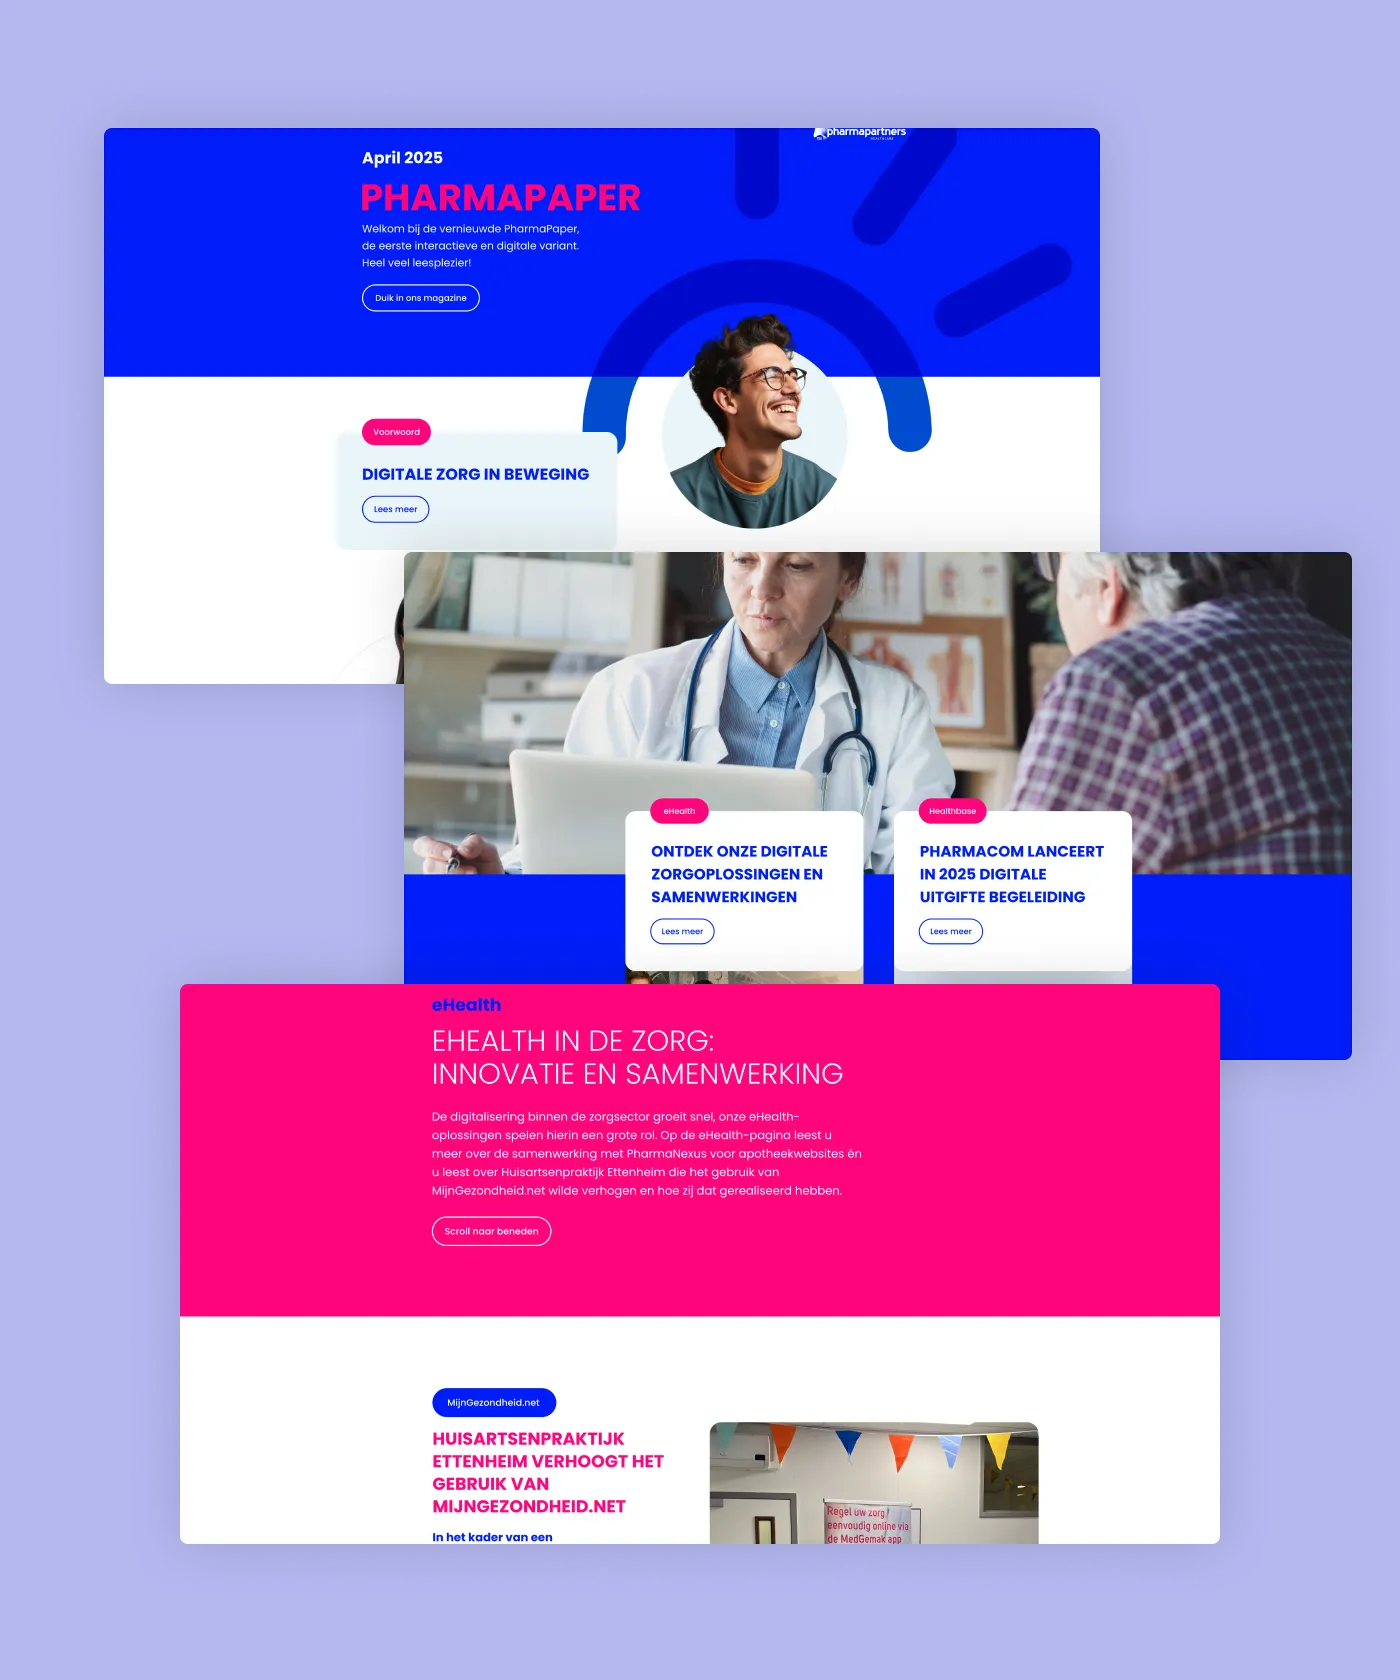
This digital magazine provides updates on healthcare innovation, focusing on smart software solutions to improve efficiency and patient care in the sector.
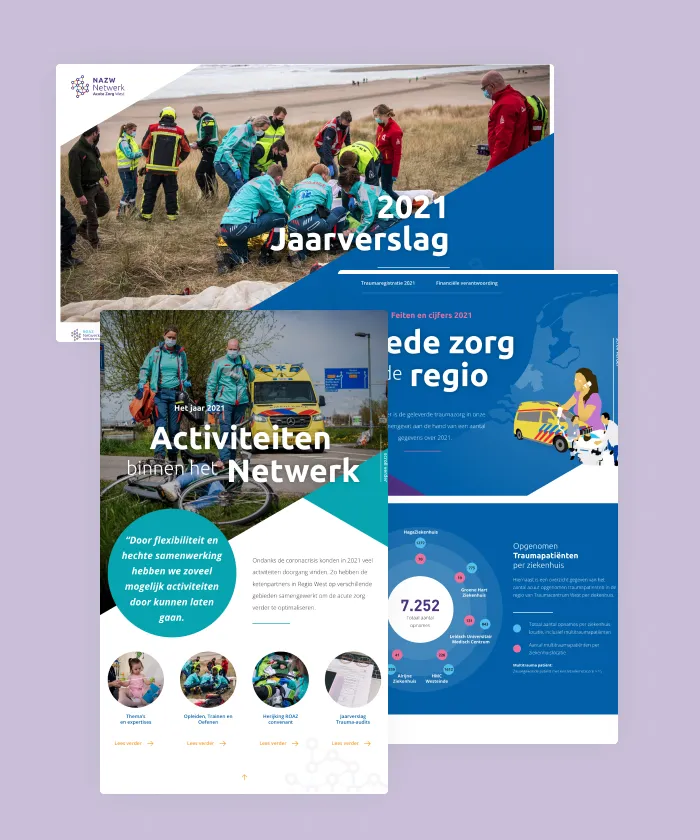
Every year, the NAZW publishes an interactive annual report full of infographics, in which they share the activities carried out by the network for the assigned (statutory) tasks.
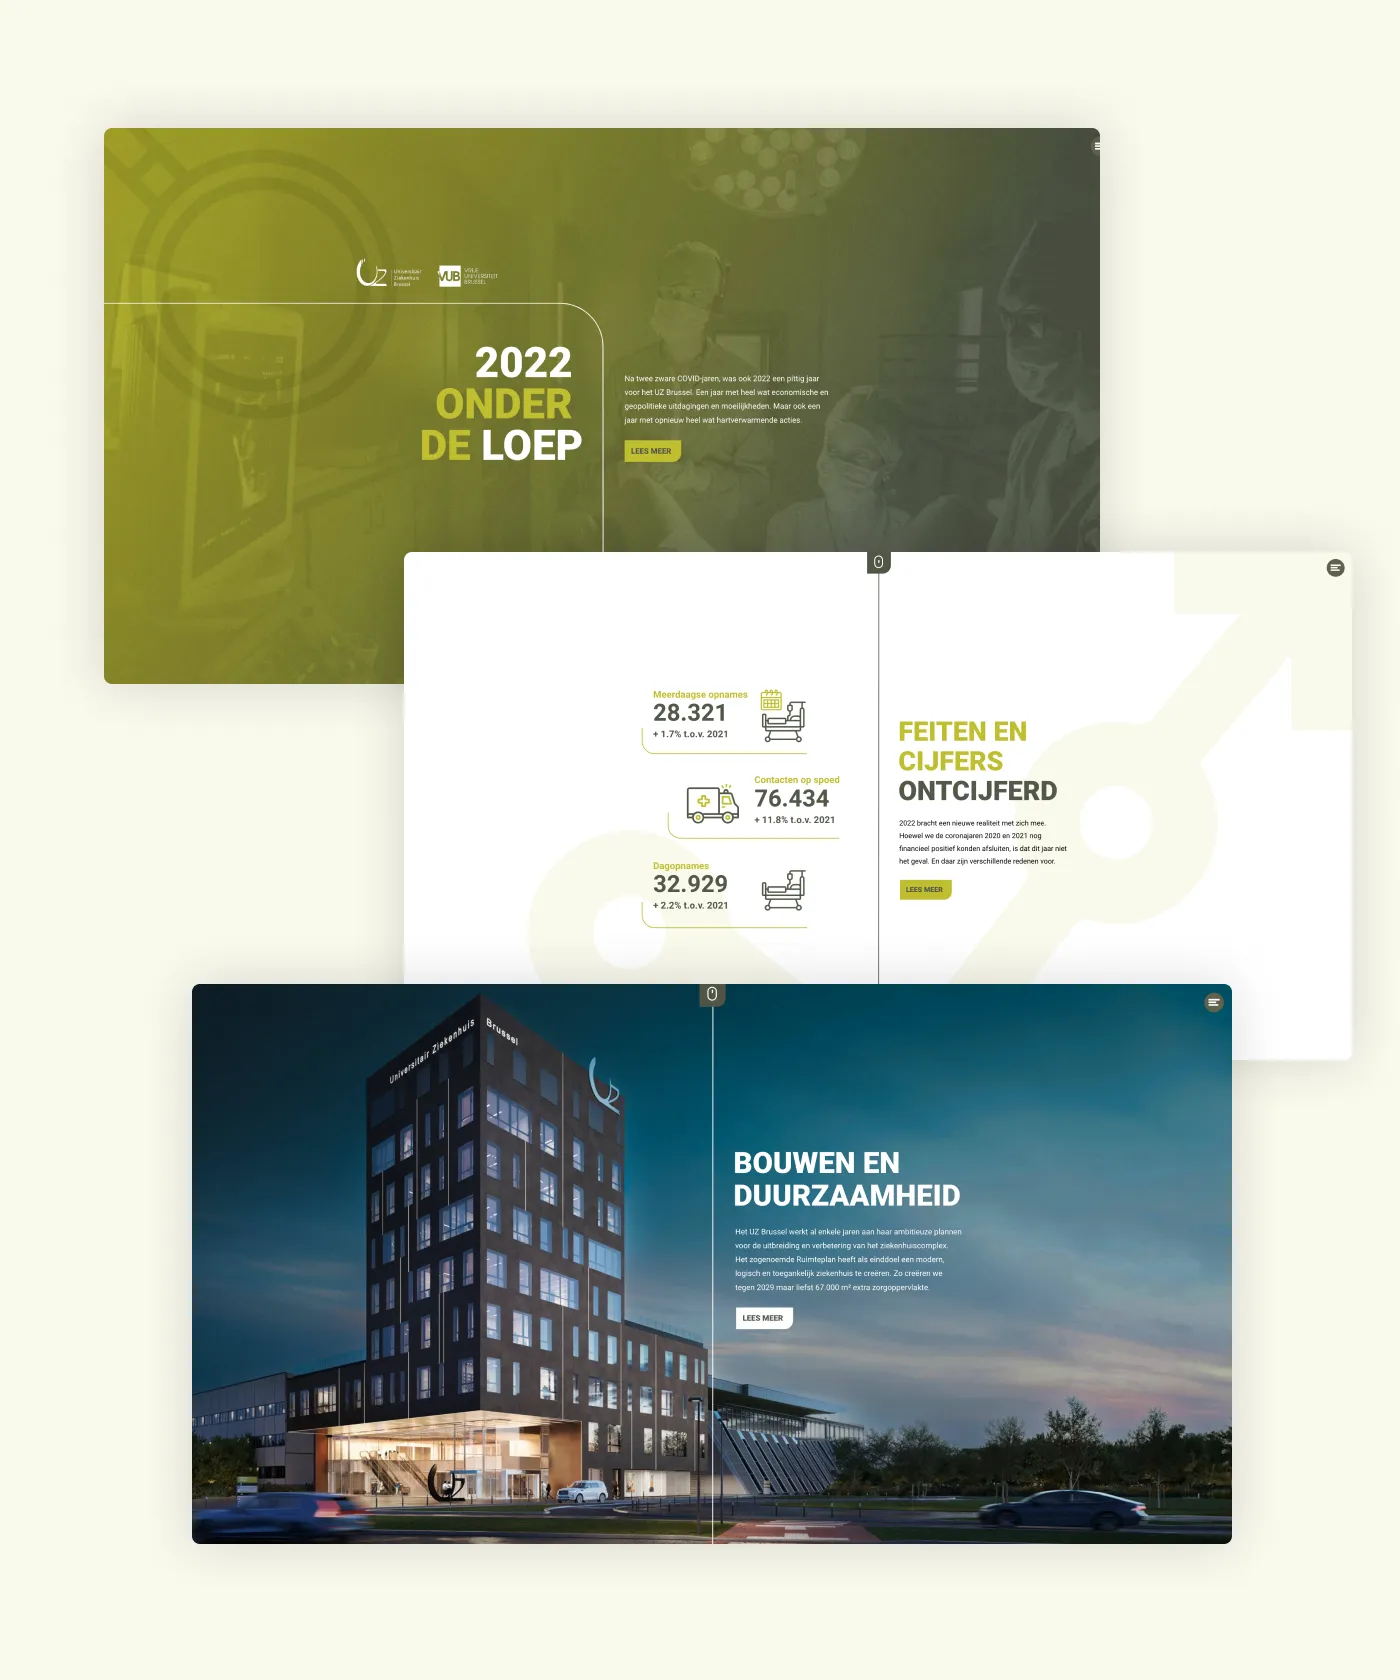
UZ Brussels 2022 annual report

In this digital magazine on pregnancy, Doomijn uses interactive timelines and custom animations to show pregnant people all they need to know to get ready for parenthood.

New developments in medicine, such as innovative technologies and drugs, are expanding possibilities. The Nederlandse internisten vereniging emphasizes that these advancements must be evaluated for their contributions to the best care and quality of life for patients.
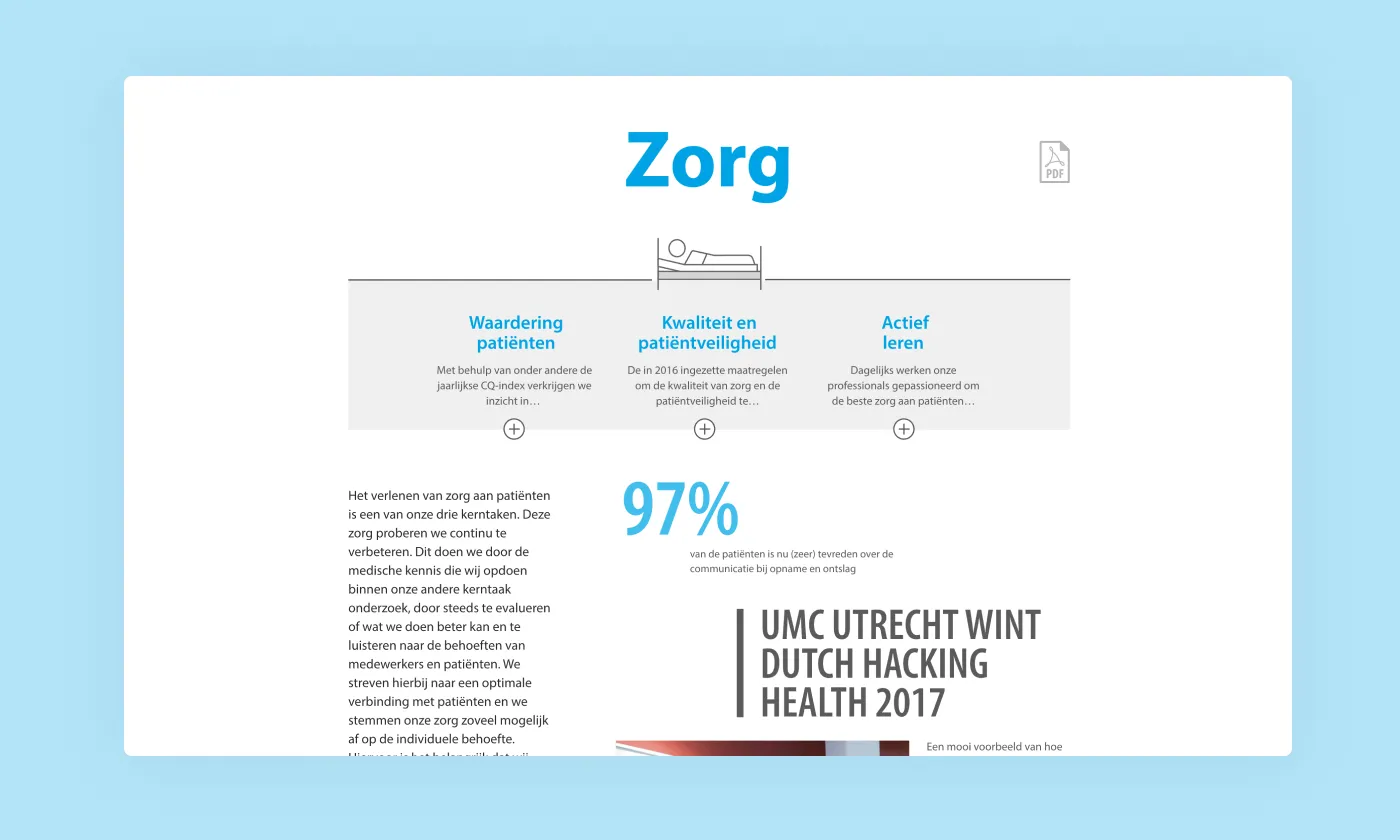
In this digital infographic, UMC Utrecht shows their achievements in 2017.
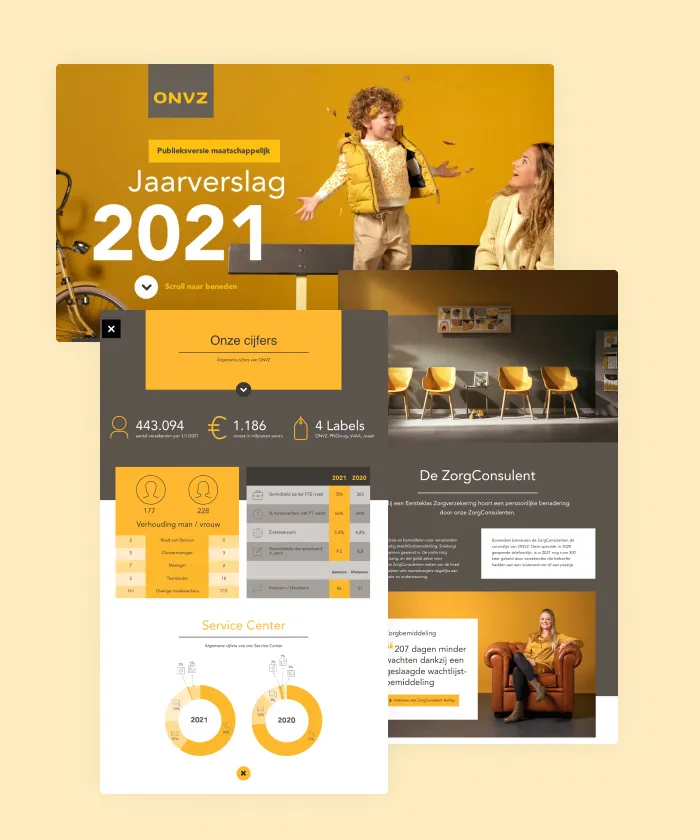
Using animations, pop-ups and subpages, ONVZ informs their audience about their annual results and what lenghts they go through to deliver the best health care to their people.


