

ROC van Amsterdam
Hop on the train and discover 'ROC van Amsterdam's' multi-year strategy for 2026. Visualised in an interactive storytelling journey.

ETZ
This interactive infographic offers a deep dive into the numbers of ETZ, which are brought to life using custom animations, effects, and pop-ups.

Action
In this interactive Update2021, Action shares all about their achievements and ambitions towards a sustainable future.

ONVZ
Using animations, pop-ups and subpages, ONVZ informs their audience about their annual results and what lenghts they go through to deliver the best health care to their people.

Gemeente Lansingerland
In this engaging online report, interactive features and animations display the goals and ambitions of Lansingerland.

ONVZ
This annual report takes you through the most important numbers in an interactive way. Animations, pop-ups and multilayered pages turn this report into an engaging experience.

Zorg & Welzijn ZHZ
In this interactive report, Zorg & Welzijn ZHZ shows its numbers and data through the power of interactive content, drastically increasing its readibility.

Dentsu
In this digital report, Dentsu reflects on recent changes in the EMEA region to help clients navigate the now, and design for what's next. Using custom buttons and animations, the publication is turned into an interactive experience.
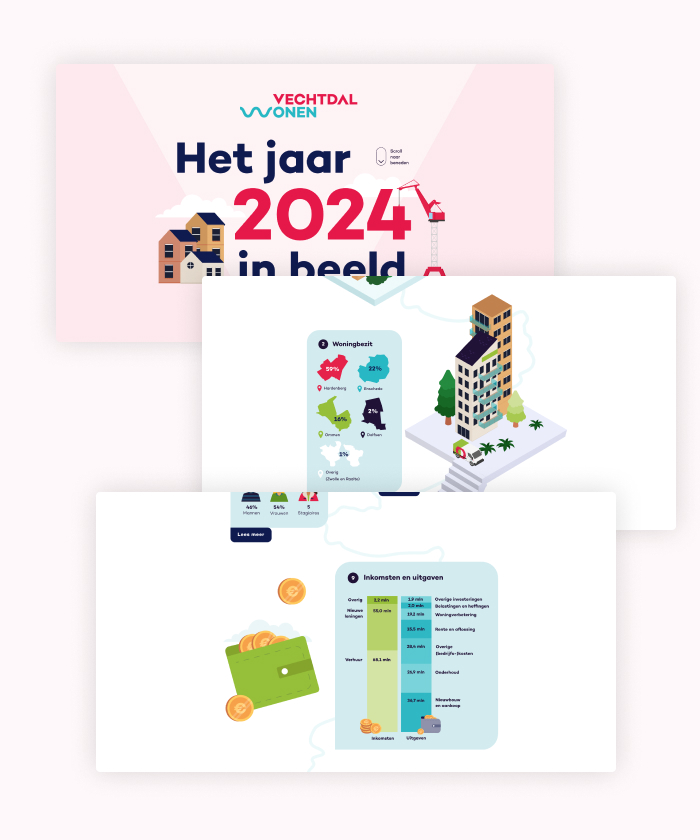
Vechtdal Wonen
In their interactive annual report, Vechtdal Wonen displays their results using custom infographics and repeating animations to bring an engaging experience to their audience.


