Created by
Maglr Studio
See how we helped our clients with all types of interactive stories.
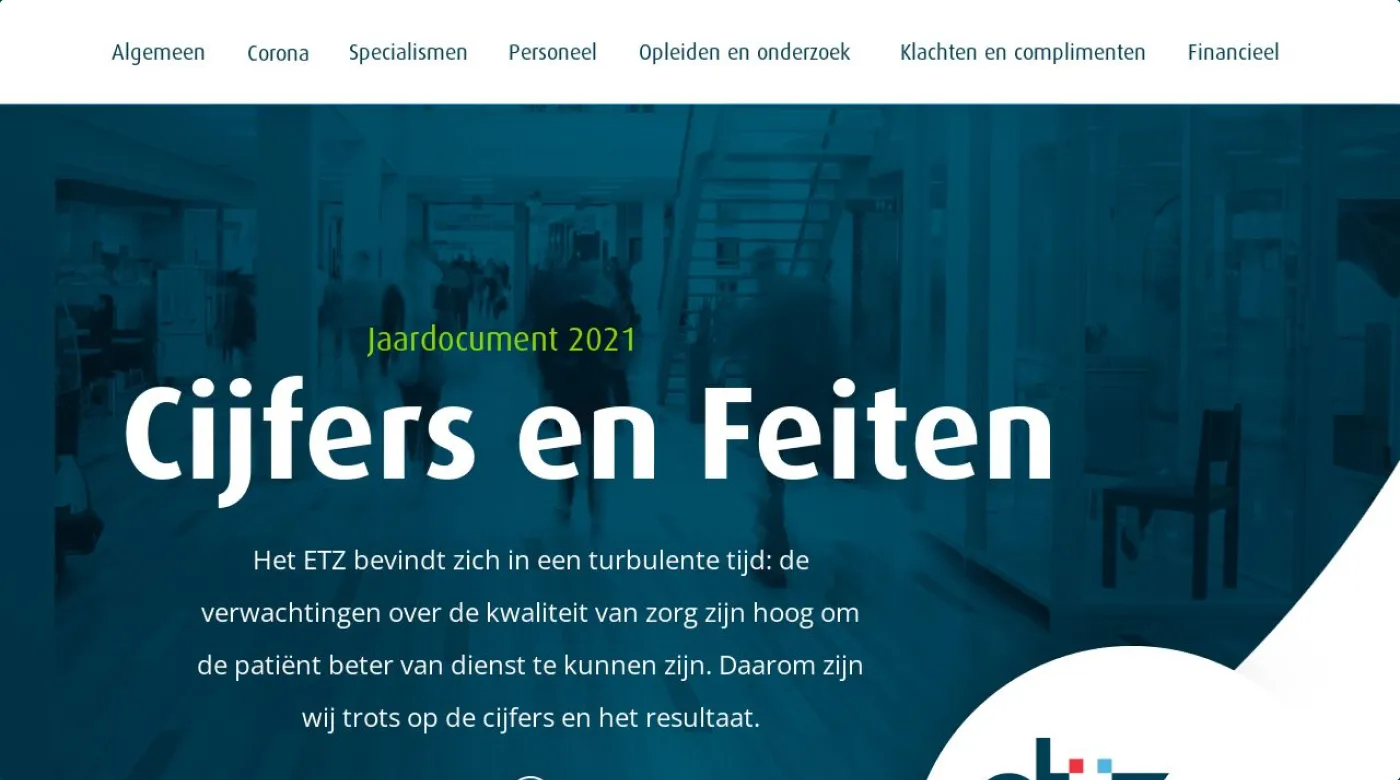
This interactive infographic offers a deep dive into the numbers of ETZ, which are brought to life using custom animations, effects, and pop-ups.

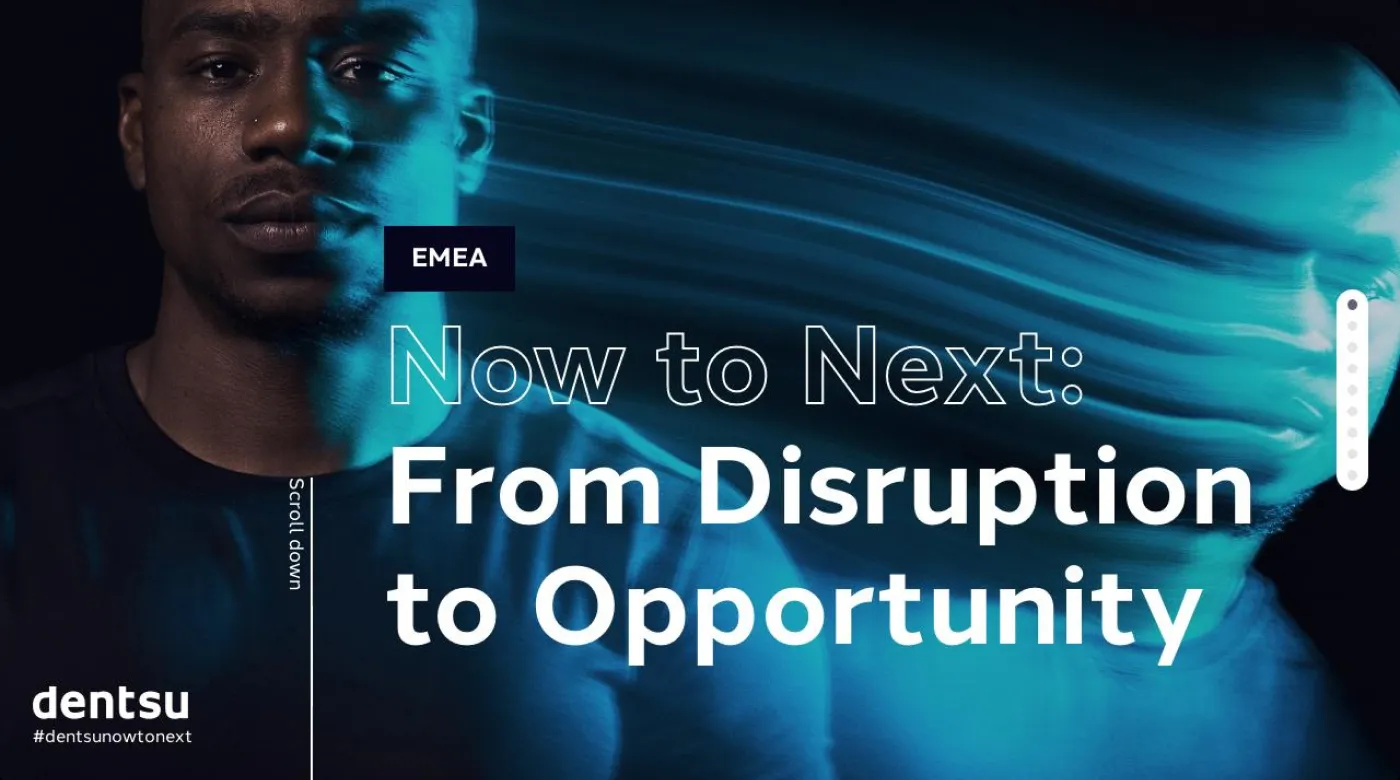
In this digital report, Dentsu reflects on recent changes in the EMEA region to help clients navigate the now, and design for what's next. Using custom buttons and animations, the publication is turned into an interactive experience.
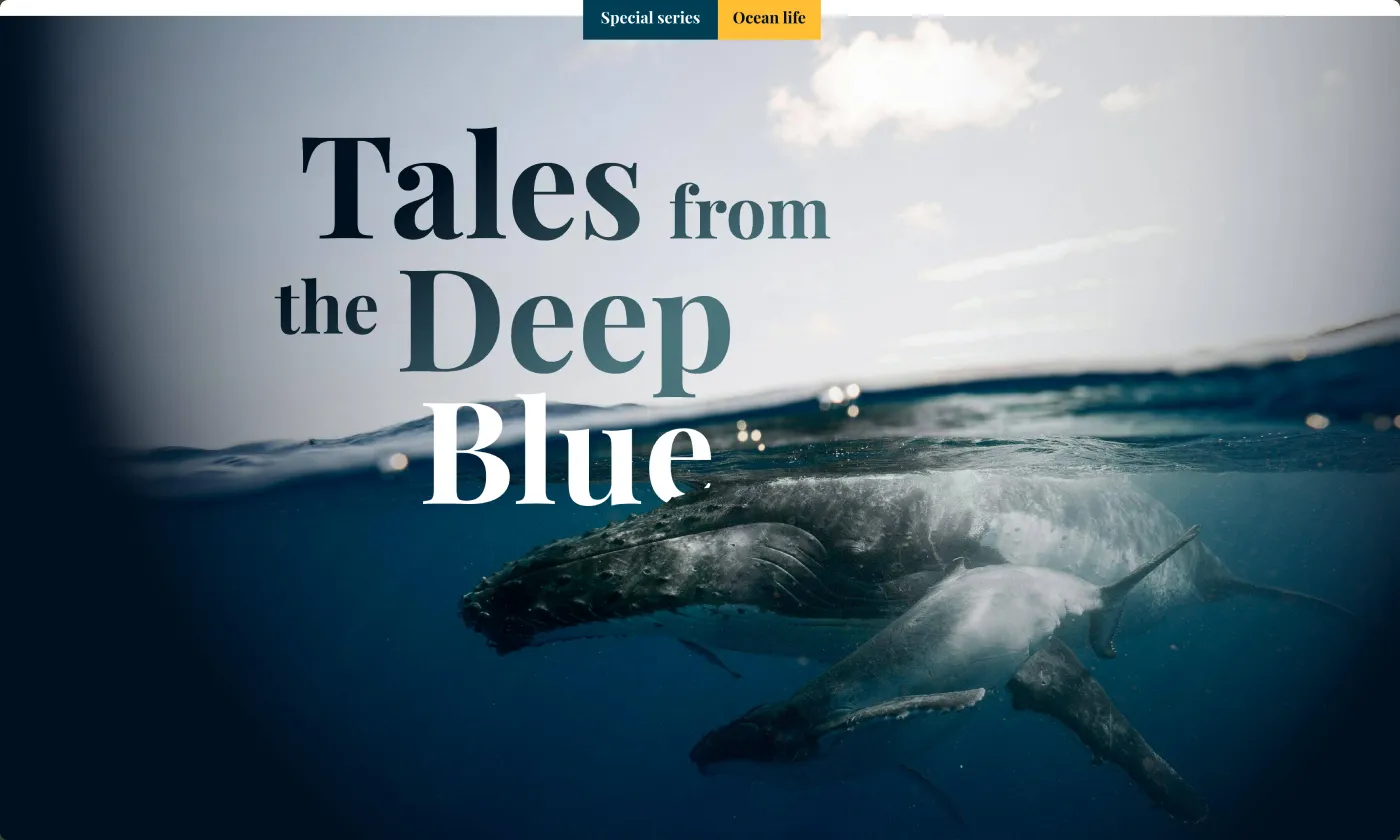
This editorial special by Maglr Studio dives deep into ocean wildlife, following the journey of whales and the impact they have on our planet.
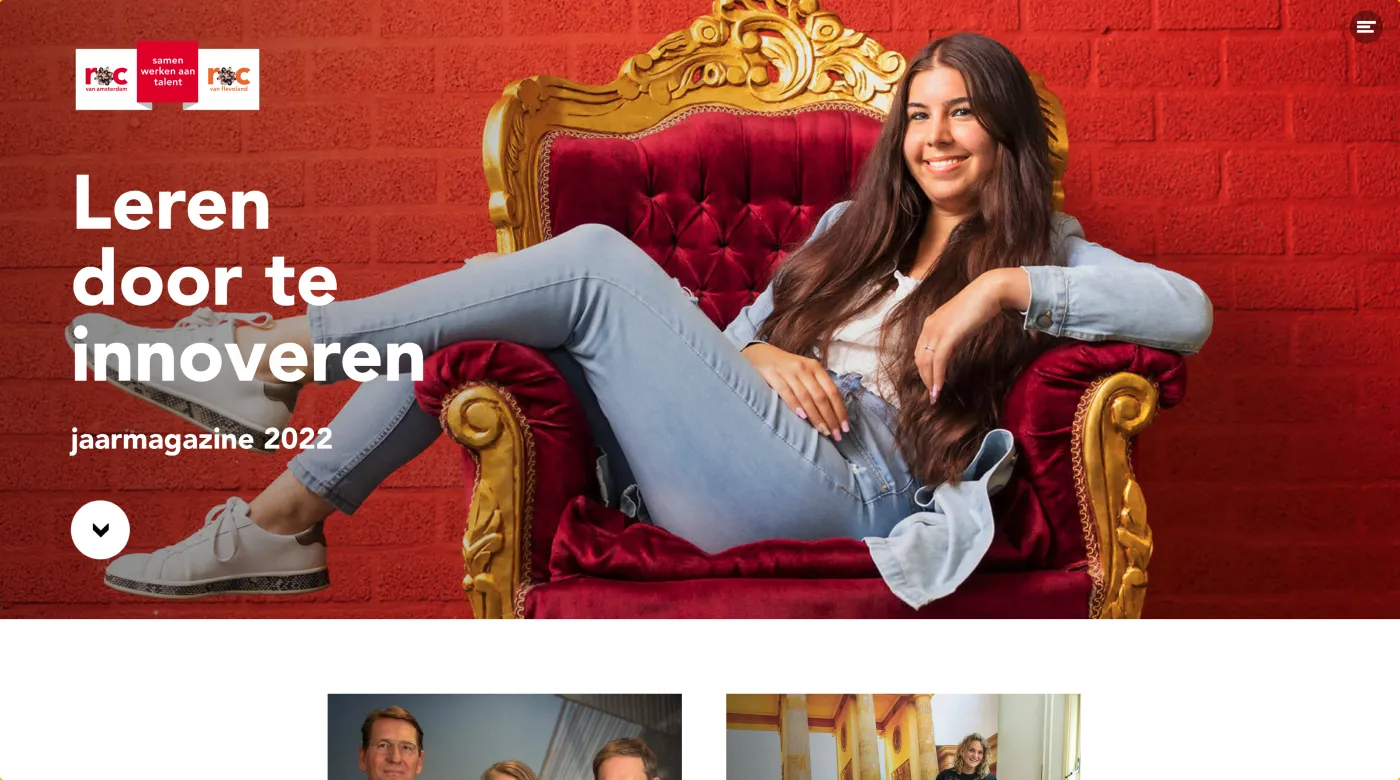
This interactive magazine shows their results over 2021 and the goals for 2022.
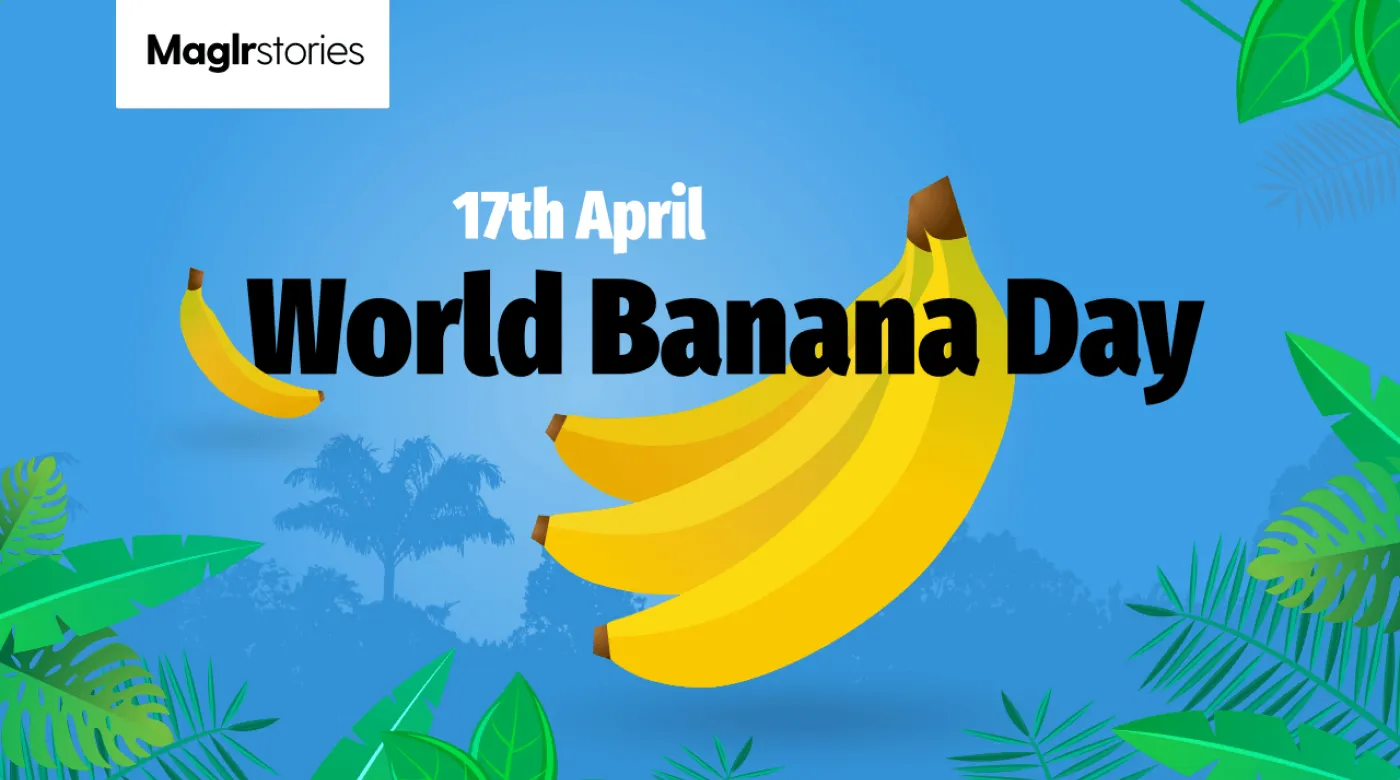
In this feature highlight, the designers of our in-house Maglr Studio went bananas with loads of custom-made keyframe animations to celebrate World Banana Day. It even contains a quiz at the end!