While the contents of an annual report are serious, creating an interactive annual report allows you to be visually appealing and engaging without sacrificing professionalism. Interactive reports offer an excellent opportunity to double as a marketing tool, especially when well-designed. In this article, we'll help you understand what makes great interactive annual report design and provide you with some inspiring examples.
What is an annual report?
Let’s state the obvious: an annual report is a report that is published, well… annually. However, to be more precise, an annual report is an overarching term for reports published by businesses reflecting on the activities of the preceding year. Often such a report elaborates on the company’s operations, financial performance, and actions in regards to climate change and social responsibility. These topics may be combined in one large report, though it is not unusual to report certain topics separately. For example, CSR reports are a very specific type of report about sustainability and corporate social responsibility.
When creating an annual report for the sake of generally reporting on your business, you’re expected to include at least some crucial components. In a nutshell, these are:
- General corporate information: such as revenue, your number of employees, and location
- Performance highlights: achievements from last year
- Financial statements: insight into your cash flow
- Future outlook: plans for the future and elaborating on strategy
Who do you write an annual report for?
Annual reports are primarily written for shareholders, investors, and stakeholders who need to assess company performance and make investment decisions. Creating and designing an interactive annual report can be a lot of work, but the benefits make the effort worthwhile. Not only is transparency highly appreciated these days—your report builds trust by demonstrating accountability. As a result, your organization attracts potential investors and enhances its reputation among current stakeholders.
Are annual reports mandatory?
Overall publishing an annual report is not strictly mandatory, and many companies tend to choose to do so for the sake of transparency. However, in some cases, producing an annual report may be required by law. Naturally, this is dependent on which country you live in. The incorporation of the CSRD in the European Union (EU) does obligate some form of sustainability reporting for many companies based in the EU. Moreover, in the US, annual reports have been mandatory since the Wall Street Crash of 1929. Therefore, it is recommended to check which laws apply to your business on your government’s website.
Why you should stop using PDFs
Static PDFs fail to meet modern reader expectations for engagement and interactivity—and that’s a problem if you want your annual report to double as a marketing tool. Research shows that interactive content generates 2x more conversions than static formats, with readers spending 52% more time with content that includes interactive elements. If building trust and brand awareness is your goal, a PDF file isn’t going to cut it.
The standard for most companies is to create their annual report in programs like Word and InDesign and then export it to PDF. While this was common practice years ago, interactive annual report platforms like Maglr now offer modernized alternatives that transform reports into engaging, website-like experiences.
These platforms enable you to create interactive annual reports with rich animations, multimedia elements, and dynamic features without requiring technical expertise. You can think outside the box, like including a filmed foreword from your CEO instead of written text, adding animated data visualizations, or incorporating scroll-triggered effects that guide readers through your story. If you get creative with your interactive designs, you may even find yourself competing for awards such as the Red Dot.
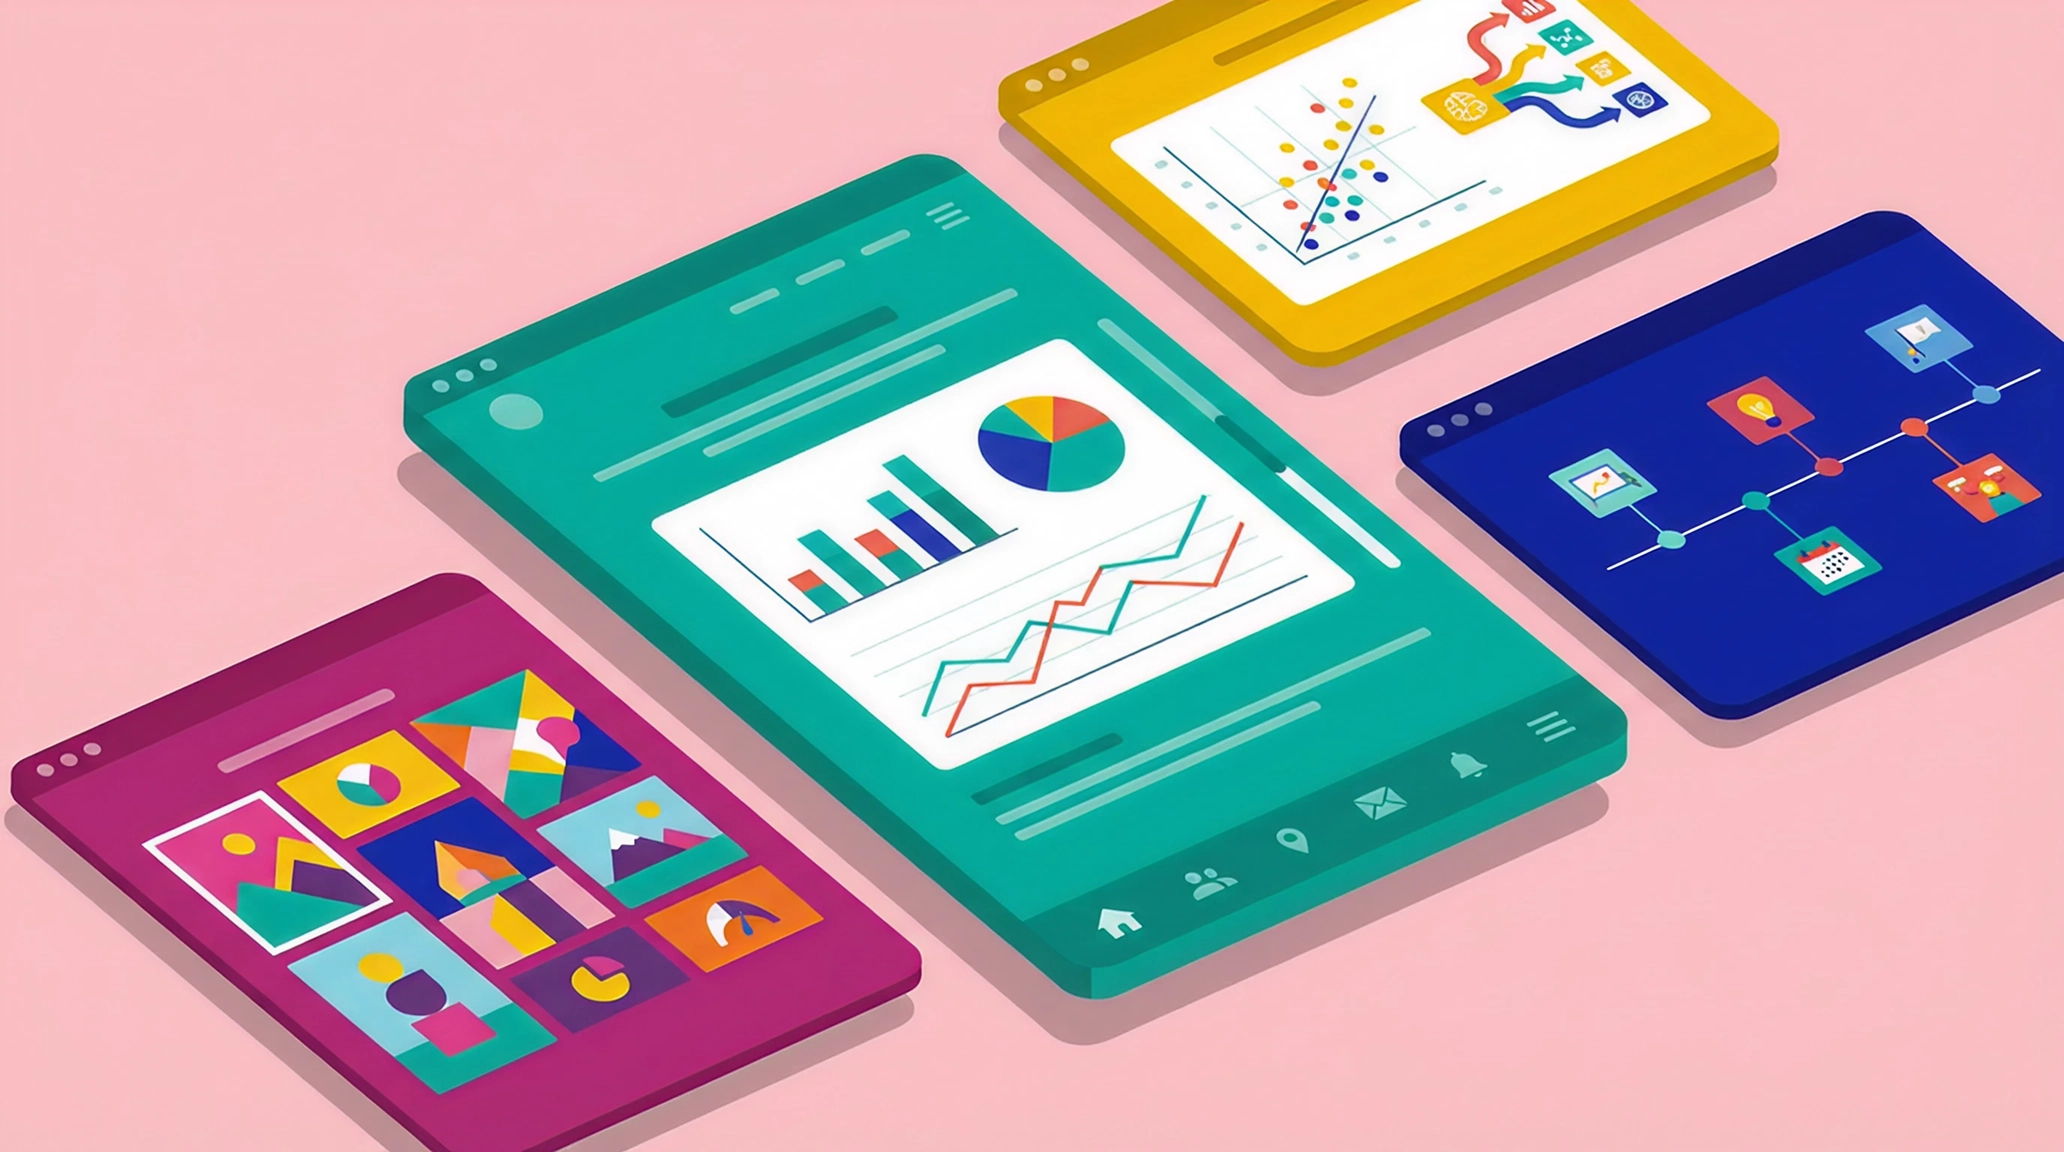
What makes annual reports interactive?
Interactive annual reports go much beyond static PDFs by incorporating elements that respond to user actions and create dynamic experiences. Key features that make annual reports interactive include:
Video and multimedia: Embedded videos, audio messages, and image galleries that bring your story to life
Clickable navigation: Tables of contents, sticky navigations and section menus that allow readers to jump directly to the information they’re looking for
Data visualizations: Charts and graphs that animate as readers click, hover and scroll, revealing data progressively rather than all at once
Scroll-triggered effects: Visual elements that appear, move, or transform as readers progress through the report
These interactive elements transform passive reading into active participation, keeping stakeholders engaged while making complex information more digestible.
How to design a good interactive annual report
What exactly defines “good design” in annual reports? For that, we need to consider who is reading our report and for what purpose. With that in mind, we have composed some tips to make your next digital report a success.
Create an interesting cover
An interactive annual report does not adhere to a “traditional” cover. It is an entry point for the reader, referred to in websites as the homepage. An interesting cover should reflect your brand and clearly state what the report is about. Interactive platforms like Maglr make it easy to create dynamic cover pages with scroll effects, animations, and multimedia that immediately capture attention, which is far more engaging than a static PDF thumbnail.
The design should reflect your brand
An essential detail in annual report design is to make sure to use your own logo, colours and fonts. The design should be unmistakably your brand. Your marketing team will be happy to see that the report carries the same ‘look and feel’ as the rest of your communication. Think about your report’s layout, but don’t forget to incorporate the same style in visual elements, such as infographics or charts.
Clear navigation
Clear navigation is essential. The reality is that most annual reports will be skimmed. As they can be lengthy, most readers will search for pieces of information that matter most to them. Therefore, it is crucial to incorporate a table of contents and/or a centralised navigation. Besides quick navigation, it provides a summarised overview of the topics that are discussed in the report. Additionally, most online reports allow the tracking of reading behaviour. Simply keep an eye on which sections are clicked to most as that should tell you more about your audience’s interests.
Get to the point
As mentioned before, a large portion of your readers will be skimming your report, searching for the facts and numbers. For that reason, it is important to get to the point and leave out any unnecessary details and anecdotes. Separate your information into concise sections and keep them short and scannable. In addition, visualise your data and use design techniques to emphasise the highlights. That way, your report becomes pleasurable to read and easier to digest.
Make it interactive
One of the strongest benefits of a digital annual report is the ability to add interactivity. Your report is no longer static, but becomes a web document with clickable elements. Interactive platforms like Maglr include libraries with scroll effects, hover animations, and embeds. If you’re overwhelmed by the options, a good start would be to add multimedia, such as video. Research shows that 88% of users spend more time on websites with video content, making filmed CEO messages or product demonstrations powerful engagement tools in interactive annual reports.
Visualise your data
Nobody likes scouring text or reading off tables. Luckily, nowadays, there are many tools to visualise your data in an appealing way through data storytelling. Not only are animated and interactive charts more pleasurable to look at, but they're also practical in that they’ll let you go more in-depth with clicks, hovers, and filters. The achievements of your company become visible at a glance. Perfect for those readers who prefer scanning.
Examples of interactive annual reports
Getting started with interactive annual report design from scratch isn't easy. Here are some examples of interactive annual reports created with Maglr by clients who have made interactive reporting part of their yearly communication strategy.
LC Packaging - Annual Report 2024
Pawsey - Annual Review 2024
Action - Annual report 2023
Can’t get enough? Click here to check out more interactive annual reports.
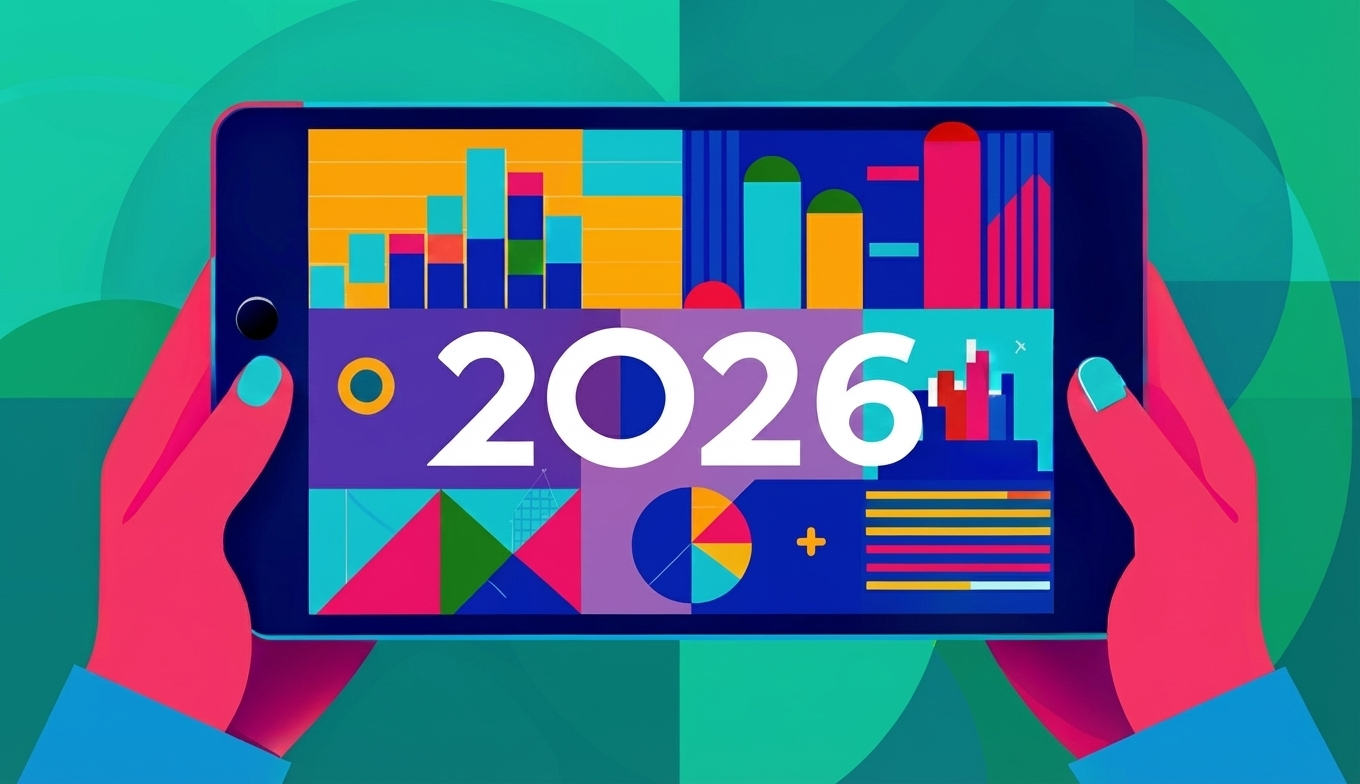
Create your interactive annual report for 2026 with Maglr
Gathering all the data and copy for your annual report is enough effort as it is. Maglr offers a quick and smooth design process. Choose to design yourself with pre-made templates or unburden yourself completely by outsourcing your report to our Studio.
Curious to know what Maglr can do for you? Talk to us or get your free 14-day trial here.